
Save Money or Feel Cozy? Bridging the Gap Between Machine Learning and Smart Grid Economics
Save Money or Feel Cozy?: A Field Experiment Evaluation of a Smart Thermostat that Learns Heating Preferences
The paper introduces an autonomous smart thermostat designed for real-time electricity pricing regimes, utilizing a Bayesian machine learning algorithm to learn individual user preferences for trading off thermal comfort against heating costs. Evaluated through a 30-day field experiment with 30 UK households, the system achieved a 38% reduction in average energy consumption during peak hours while maintaining high user trust and usability.
TL;DR
As we transition to renewable energy, electricity prices are becoming increasingly volatile. This paper presents a smart thermostat that uses Bayesian Learning to automatically manage this volatility for homeowners. By learning how much money a user is willing to save at the expense of a few degrees of warmth, the system achieved a massive 38% reduction in peak energy demand while being rated significantly easier to use than traditional manual controls.
The Problem: The Cognitive Burden of the Smart Grid
The future of energy is distributed and volatile. Real-time pricing (RTP) is an effective economic tool to stabilize the grid, but it presents a human-computer interaction nightmare:
- Constant Monitoring: Nobody wants to check electricity prices every 30 minutes to adjust their heater.
- Heterogeneous Preferences: Some people prioritize "coziness" at any cost; others are highly price-sensitive. There is no "one size fits all" algorithm.
- The Complexity Wall: Manually programming a price-sensitive schedule is cognitively exhausting, leading many to simply give up and revert to inefficient "always on" settings.
Methodology: Hiding the Market in the UI
The authors adopt the "Hidden Market Design" philosophy. Instead of forcing users to understand the underlying auction or pricing mechanics, the UI provides a simple interface where the complexity of the market is managed by an autonomous agent.
The Learning Core
The thermostat models user behavior using a linear optimal temperature equation: Where:
- is the preferred temperature when energy is free.
- is the price sensitivity.
As users interact with the thermostat (pressing '+' or '-'), the system uses Bayesian Inference to update its estimate of and .
Two Flavors of Interaction
The study compared three interfaces:
- Manual: Users manually set the price-temperature curve (Base line).
- Learning Direct: Every interaction immediately feeds into the model, and the setpoint reflects the "learned" value.
- Learning Indirect: A user's change acts as a 1-hour "override." The agent learns from this override but returns to the optimal learned path afterward.
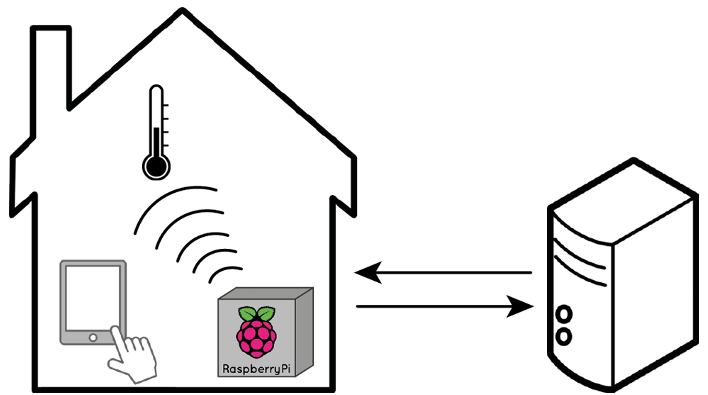 Figure 1: The schematic overview of the Raspberry Pi and web-based control system.
Field experiment & Results
The researchers deployed these systems in 30 UK homes for a month. The results were striking in two dimensions: Usability and Economic Impact.
1. Usability: Learning Trumps Manual
For active users, both learning-based interfaces were rated significantly higher for ease-of-use. Interestingly, the Learning Indirect model was the most successful. Since it allowed for temporary overrides, it avoided the frustration of "Learning Direct," where the model’s convergence could make the buttons feel unresponsive to single clicks.
2. The Power of Demand Response
Can an autonomous agent actually save the grid?
- Demand Reduction: The average reduction during price peaks was 38%.
- Thermal Inertia: Crucially, while the thermostat lowered the setpoints by 3°C during peaks, the actual house temperature only dropped by about 1°C due to the thermal mass of the buildings. Users saved money without actually "feeling" the cold.
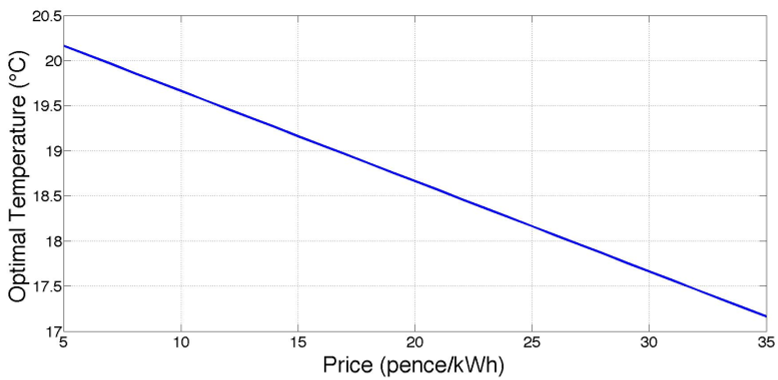 Figure 2: The average learned preference curve, showing how users naturally trade comfort for cost as prices rise.
Critical Analysis: Why This Works
The brilliance of this work lies in its Inductive Bias. By assuming a simple linear relationship between price and temperature, the Bayesian model can converge quickly even with very few data points (often 5-10 interactions).
However, there are limitations:
- Occupancy Blindness: The current model doesn't account for whether the user is actually at home, which is a significant factor in heating efficiency.
- Simulated Incentives: While the users were paid based on their performance, the heating costs were subtracted from a virtual budget. Real-world behavior might be more conservative when "real" bills are at stake.
Conclusion
This field study provides a blueprint for the "Internet of Things" in the energy sector. By delegating economic decisions to a machine learning agent that stays "hidden" behind a simple UI, we can achieve massive sustainability goals without requiring every homeowner to become a part-time energy trader.
Key Takeaway: To make the Smart Grid successful, we don't need smarter users; we need interfaces that learn to respect user preferences while navigating the complexity of the market for them.