
From Clicks to Classifications: Visualizing Banking Behavior for SME Identification
SME User Classification from Click Feedback on a Mobile Banking Apps
This paper introduces a novel computer vision-based approach for customer segmentation in mobile banking, specifically classifying users as 'SME-like' (Small and Medium-sized Enterprises) or 'Non-SME-like'. By encoding sparse temporal click-stream logs into multi-channel images and utilizing a ResNet-18 architecture, the method achieves a peak average accuracy of 71.69%, significantly outperforming traditional machine learning models.
TL;DR
Researchers have developed a way to identify "SME-like" customers—individuals who behave like businesses but aren't registered as such—by turning their mobile banking click logs into images. By treating user behavior as a visual pattern and feeding it into a ResNet-18 model, they achieved 71.69% accuracy, vastly outperforming traditional models like XGBoost that rely on manual feature engineering.
Background & Positioning
In the modern digital banking landscape, understanding who a customer is requires looking at how they act. For Siam Commercial Bank (SCB), identifying SME-like users is a priority for targeted product offerings. This paper moves away from static demographic analysis and shifts toward Behavioral Biometrics, positioning itself as a bridge between Deep Learning and traditional Customer Relationship Management (CRM).
The Problem: The "Feature Engineering" Ceiling
Traditional machine learning treats click logs as counts: "How many times did the user click 'Transfer'?" This approach has two fatal flaws:
- Temporal Loss: It loses the "when." Does a user transfer money at 2 AM (business logic) or 10 AM?
- Complexity: It requires experts to manually define what matters, which is time-consuming and prone to missing hidden non-linear patterns.
Methodology: Encoding Behavior as a Seven-Channel Image
The researchers' "Aha!" moment was realizing that time is two-dimensional: hours of the day and minutes within the hour.
1. The Mapping Process
They took 56 essential banking events and grouped them into 7 "Primary Events." For every user, they created a grid:
- Vertical Axis: Hours (0-23)
- Horizontal Axis: Minutes (binned into 2-minute intervals)
- Intensity: Frequency of clicks in that window.
2. Architecture
By stacking these 7 grids, they created a 7-channel image. While humans see in 3 channels (RGB), the ResNet-18 model can "see" in 7, allowing it to correlate "Money Movement" patterns with "Bill Pay" patterns across the time-space grid.
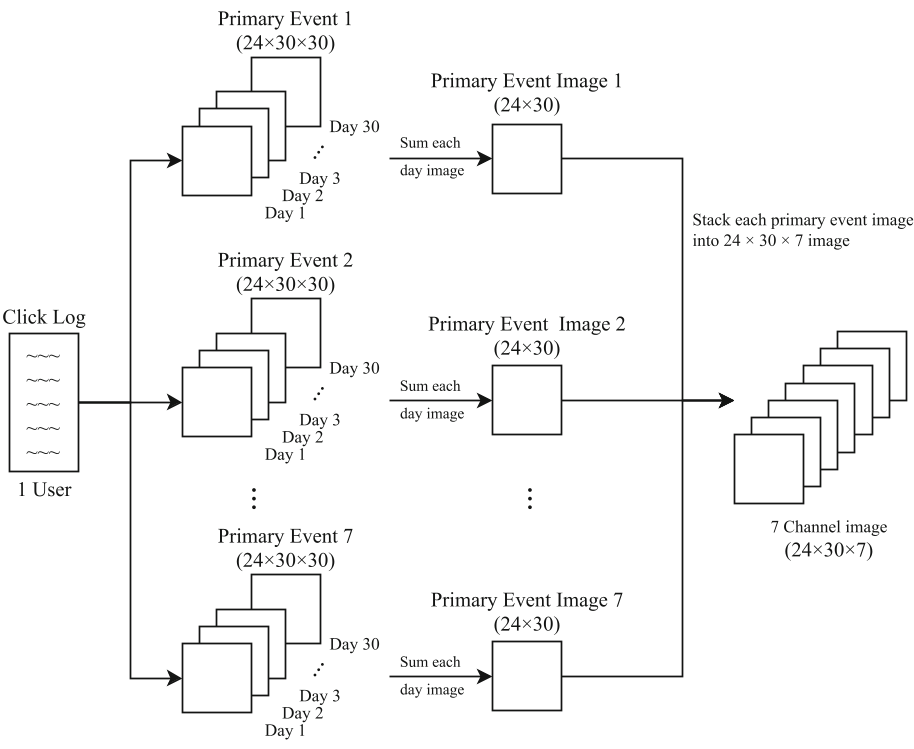 Fig 1: The pipeline from raw logs to multi-channel behavioral images.
Experiments & Results: Pixels Win Over Tables
The team compared their CNN approach against XGBoost using three sets of hand-crafted features.
- Hand-crafted Features (F_c): Accuracy hovered around 61.95%.
- Image Representation (I_7c): Accuracy jumped to 71.97%.
Interestingly, they found that as they increased the "Discarded Threshold" (removing users who rarely use the app), the model's performance scaled up. When focusing only on the most active 25% of users (75th percentile), accuracy reached 74.31%.
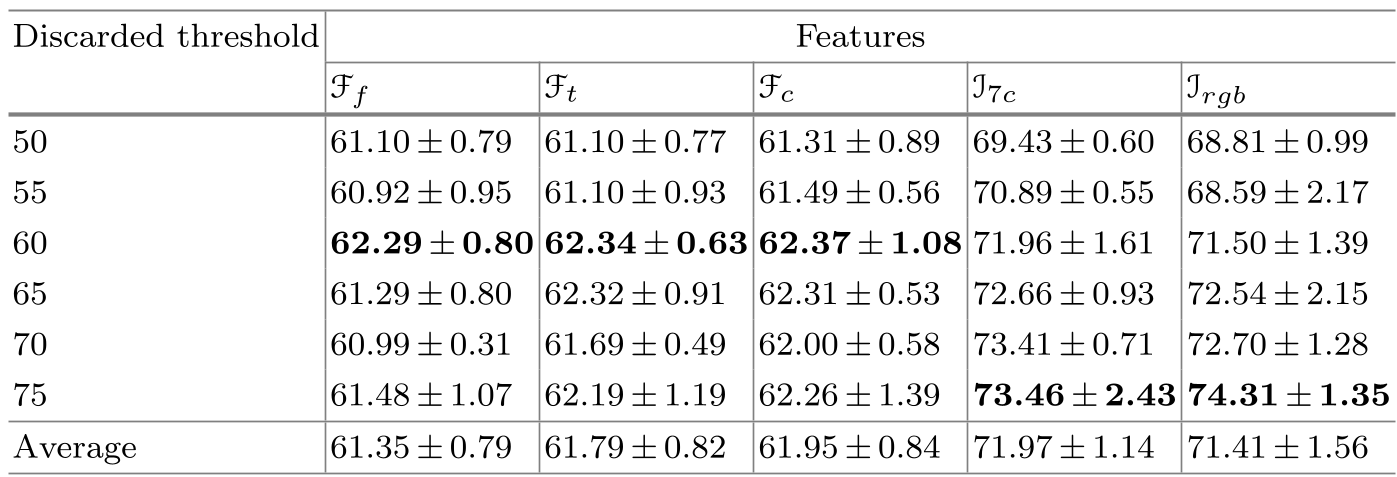 Table 1: Performance comparison showing the consistent superiority of image-based encoding (I_7c, I_rgb) over traditional features (F).
Deep Insights: The "Rhythm" of a Business
A key takeaway from the visualization was the distinct "fingerprint" of an SME. SME-like users show repetitive, high-frequency "Transfer" and "Money Movement" events during standard business hours (08:00–17:00), whereas non-SME users show sporadic activity, often centered around "Cardless ATM" withdrawals or recreational "Top-ups."
Critical Analysis & Future Outlook
Strengths: This method is highly scalable. Once the pipeline to convert logs to images is built, the model can be retrained with minimal manual intervention.
Limitations: The model currently ignores the sequence of events (e.g., does a user check their balance before every transfer?). Incorporating Graph Neural Networks (GNNs) or Transformers might capture these sequential dependencies even better.
Conclusion: This research proves that in the age of Big Data, sometimes the best way to understand a customer is to "visualize" their digital life. By treating logs as images, banks can unlock sophisticated segmentation that was previously hidden in billions of rows of CSV data.