
Social Influence: From Viral Contagion to a Richer Causal Understanding
Social Influence: From Contagion to a Richer Causal Understanding
This paper proposes a formal causal framework to disentangle social influence from other confounding factors in observational Big Data. It utilizes Graphical Causal Models (GCMs) to demonstrate how personal similarity, item traits, and external circumstances bias influence estimation, providing a systematic methodology for Computational Social Science.
TL;DR
In the era of "Big Data," we often mistake correlation for influence. If two friends post the same hashtag, did one influence the other, or do they just like the same things? This paper breaks down the "contagion" myth by introducing a Graphical Causal Model framework. It identifies three major confounders—Similiarity, Item Traits, and External Environment—and provides a mathematical roadmap for researchers to extract "pure" influence from messy observational data.
Background: The "Inluential" Illusion
For years, marketers and sociologists have chased the "influential" individual—the idea that a single person can trigger a viral cascade. However, most observational studies overestimate this effect because they ignore Homophily (the tendency for similar people to befriend each other). The authors argue that we must move from simply observing what happened to asking why it happened using the rigors of causal inference.
The Core Problem: Why Influence is Hard to Measure
The central challenge is confounding. An unobserved common cause can affect both the "influencer" and the "target" .
- Homophily: and are friends because they are similar.
- External Circumstances: Both and saw a news report and reacted independently.
- Item Traits: The content itself is so provocative (e.g., high emotional arousal) that everyone would share it regardless of social ties.
Methodology: The Deconfounding Framework
The authors use Directed Acyclic Graphs (DAGs) to visualize these relationships. In a DAG, an arrow from represents a direct causal effect.
1. The Simple Confounder
The paper utilizes Pearl's "do-calculus." To find the true effect of action on , we must block the "back-door" paths created by common causes.
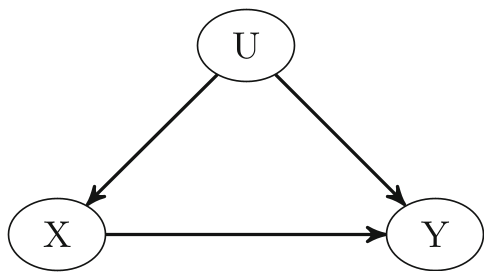 Figure 1: The standard confounding structure between cause X and effect Y.
2. The Integrated Social Model
The authors combine various stressors into a single "Full Model."
- : Shared latent traits (e.g., both are into sci-fi).
- : Traits of the focal item (e.g., a viral video's production quality).
- : External circumstances (e.g., a global holiday).
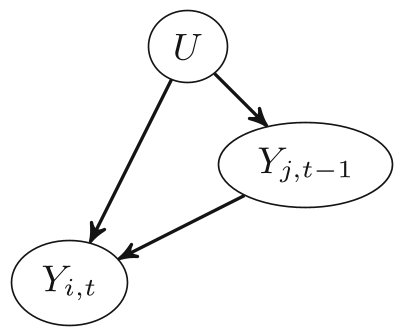 Figure 2: The complete framework showing how social influence is confounded with personal similarity, item traits, and external world events.
To get an unbiased estimate, the investigator must measure and adjust for . Without adjusting for these, any "contagion" effect recorded is likely a mix of influence and coincidence.
Deep Insights: Beyond Binary Outcomes
The paper pushes past the binary "did they click or not?" metric. They suggest looking at:
- Magnitude & Direction: Was the influence superficial or did it change a core belief? Did it cause the person to do the opposite?
- Informational vs. Normative: Did the user adopt the behavior because it was useful (informational) or just to fit in (normative)?
- Effort and Risk: Influence is easier for re-sharing a tweet than for quitting smoking. High-risk behaviors require much stronger causal alignment between personal traits () and external support ().
Critical Evaluation of Existing Research
The authors apply their framework to famous studies:
- Facebook App Study: Even in randomized experiments, if "personal interest" (W) isn't measured, we can't be sure the app download was due to the friend's message or the user's pre-existing love for films.
- Amazon Recommendations: "Users who bought X also bought Y" might highlight similarity rather than influence. The paper notes that these systems often provide an upper bound of influence rather than the exact value.
Conclusion and Future Outlook
The "viral contagion" metaphor is often too simplistic. The real world is a complex interaction of personal identity, item traits, and societal context.
Key Takeaways for Data Scientists:
- Measure More, Suppose Less: If you only track social ties and timestamps, your influence metrics are inflated.
- Context is Key: Always account for external "shocks" (news, trends) using a variable .
- Qualitative Depth: Use surveys or sentiment analysis to determine if social influence was 'internalized' or just a temporary reaction.
Future research in Computational Social Science must move toward "richer" datasets that capture the unobserved variables identified here to transition from mere description to true causal explanation.