
Shapley vs. SNI Centrality: Identifying Key Players Through Game Theory and Influence Dynamics
13453_Interplay between Social Influence and Network Centrality A Comparative Study on Shapley Centrality and Single-Node-Influence Centrality.
This paper explores the interplay between network centrality and dynamic social influence models, specifically comparing Single-Node Influence (SNI) and Shapley Centrality. It introduces an axiomatic framework to differentiate these measures and provides scalable, sampling-based algorithms (ASV-RR and ASNI-RR) that achieve near-linear time complexity for massive social networks.
TL;DR
Researchers from Microsoft Research and USC have bridged the gap between static network topology and dynamic social influence. By leveraging Shapley values from cooperative game theory and high-performance Reverse Reachable (RR) set sampling, they’ve created a scalable way to measure a node's true "power" in a group. Unlike simple influence metrics, their approach identifies nodes that are truly irreplaceable within a social ecosystem.
Background: Beyond Static Graphs
Most of us are familiar with Degree Centrality (how many followers you have) or PageRank (how important your followers are). However, these are static snapshots. In the real world, influence is a dynamic process—think of a viral meme or the spread of a new technology.
The core problem is that existing dynamic measures like Single-Node Influence (SNI) look at a node in a vacuum. If you and your neighbor reach the same 1,000 people, SNI treats you both as equally vital. But in a group setting, one of you might be redundant. This paper asks: How do we measure a node’s marginal, irreplaceable contribution to a collective effort?
Methodology: The Power of the Shapley Value
The authors propose Shapley Centrality. Originating from cooperative game theory, the Shapley value calculates the average marginal contribution of a player across all possible coalitions.
1. The Mathematical Intuition
The Shapley value for node is defined as: Where is the influence spread function and is the set of nodes appearing before in a random permutation. In plain English: On average, how many NEW people do you reach that weren't already reached by the people before you?
2. Scalable Computation via ASV-RR
Computing this exactly is #P-complete (computationally "impossible" for large graphs). The authors solve this using Reverse Reachable (RR) sets.
- The Logic: Instead of simulating forward spreads, they start from a random "target" node and look backward to see which "source" nodes could have influenced it.
- The Breakthrough: They prove that a node's Shapley centrality is proportional to the probability it appears in an RR set, weighted by the reciprocal of the set's size ().
 Figure 1: The interplay between dynamic influence processes and static network structures requires a dual axiomatic-algorithmic approach.
Why Your Position Doesn't Always Matter
One of the paper's most provocative findings is the Symmetry in Symmetric IC Models. In an undirected graph where influence flows equally both ways, every node in a connected component has a Shapley centrality of exactly 1.
This suggests that if influence is truly symmetric, your position (center vs. periphery) doesn't make you more "powerful" in a game-theoretic sense because you are easily replaced by your neighbors. This insight exposes the limitations of using undirected graphs for influence modeling—true influence is almost always asymmetric.
Experimental Battleground
The researchers tested their algorithms on massive datasets, including LiveJournal (4.8M nodes, 69M edges) and Flixster.
Key Findings:
- Scalability: The ASV-RR algorithm handled 69 million edges in a few thousand seconds—a feat previously impossible for Shapley-based metrics.
- Quality: When using the top-ranked nodes for Influence Maximization (IM), Shapley Centrality outperformed SNI. In the Flixster dataset, Shapley was 8.3% more effective at starting a cascade.
- Real-World Insight: In a Data Mining collaboration network, big names like Jiawei Han and Philip S. Yu naturally topped the lists, but Shapley highlighted researchers with "unique" impact who might have been ranked lower by pure influence volume.
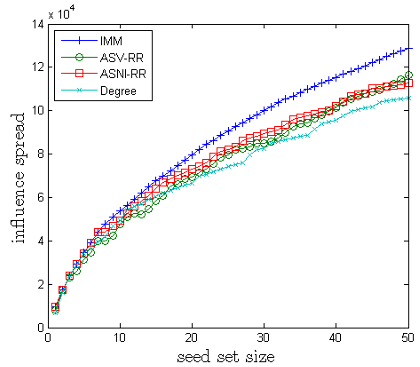 Figure 2: Influence spread comparison. Shapley-ranked seeds consistently track the performance of the specialized IMM (Influence Maximization) algorithm.
Critical Insight & Future Work
The value of this paper lies in its axiomatic rigor. By defining exactly what "fairness" and "influence" mean via 5 core axioms, the authors provide a standard for evaluating future centrality measures.
Limitations: The "replaceability" aspect of Shapley values can be counter-intuitive. In some marketing contexts, you might want redundancy (high SNI) rather than unique marginal contribution (high Shapley). Furthermore, the current model assumes a Discrete Time Independent Cascade model; adapting this to continuous-time or non-progressive models remains an open challenge.
Conclusion
This study proves that measuring "influence" is not just about reach—it's about the unique value a node brings to a coalition. With the ASV-RR algorithm, we finally have the tools to apply these high-level game-theoretic concepts to the scale of the modern social internet.