
Social Influence in Social Advertising: Why Your Friends' Interests Drive Your Clicks
Social influence in social advertising: evidence from field experiments
This paper presents two massive-scale field experiments on Facebook to quantify the causal impact of social cues in online advertising. It introduces the "cue-response function" to measure how peer affiliations (e.g., "Friend X likes this brand") influence click-through and conversion rates, finding that social signals significantly outperform baseline advertising.
TL;DR
Is your decision to "Like" a brand driven by a genuine interest, or simply because your best friend did it first? This seminal work from Meta (formerly Facebook) utilizes two field experiments involving millions of users to prove that social cues—the small snippets of text telling you which friends like a brand—significantly increase ad efficacy. More importantly, the researchers found that influence isn't equal: a "strong tie" (a close friend you talk to often) has a far greater impact on your behavior than a casual acquaintance.
The "Birds of a Feather" Catch: Homophily vs. Influence
The central challenge in social network research is Homophily. If both you and your friend click on an ad for a new sci-fi movie, is it because your friend influenced you? Or is it just because you both already liked sci-fi movies, which is why you became friends in the first place?
Prior observational studies often overstate "virality" because they can't separate these two factors. This paper uses the "Gold Standard" of causal inference—Randomized Controlled Trials (RCTs)—to break this loop. By randomly showing or hiding names of peers, the researchers isolated the pure effect of social influence.
Methodology: Engineering the Social Signal
The researchers conducted two large-scale experiments to map the "Cue-Response Function."
Experiment 1: The Power of Numbers
In "Sponsored Stories" (ads that look like organic news feed posts), they varied the number of peers shown (1, 2, or 3).
- The Insight: As the number of social signals increases, the response rate climbs. However, this follows a "simple contagion" model—the increase is roughly linear rather than exponential.
Experiment 2: The Minimal Social Cue
To remove any visual bias (like ad height), they created a minimal cue: a single line of grey text. They compared:
- Social Treatment: "Friend X likes this."
- Control: "1,234 people like this."
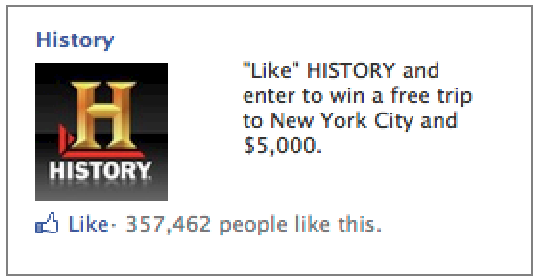 In Experiment 2, researchers compared the influence of a specific peer (left) against a generic count of likes (right).
The Key Driver: Tie Strength
The paper’s most profound contribution is the quantification of Tie Strength. By measuring the frequency of comments and private messages over 90 days, the team categorized relationships from "Weak" to "Strong."
The results were clear: social influence is a function of relationship depth. Even if no cue is shown, you are more likely to behave like your close friends (homophily). But when a social cue is shown, the marginal boost in your probability of clicking is much higher if the name shown is a close friend.
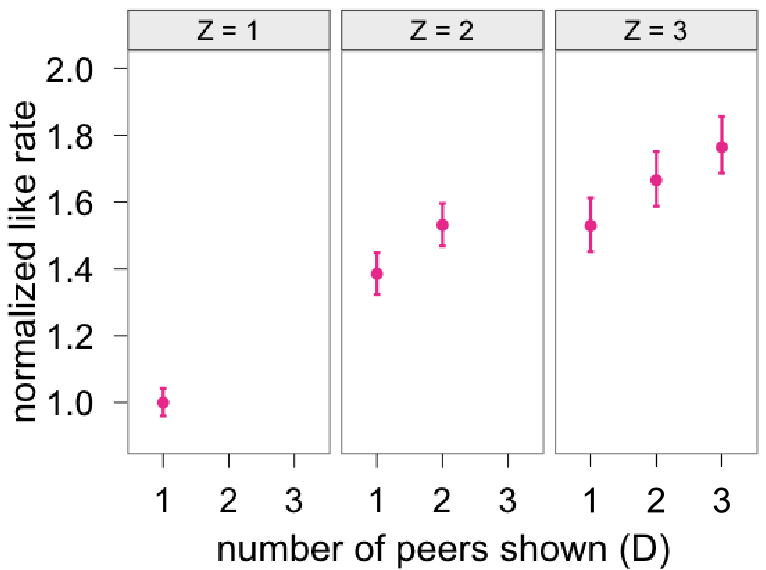 Figure (a) shows the increase in click rates as the number of affiliated peers increases across different treatment conditions.
Quantitative Impact
- Click Rate Increase: A single peer cue increased clicks by ~5%.
- Conversion ("Like") Increase: Peer cues increased brand connections by ~11%.
- Strong Tie Advantage: High-communication ties showed a significantly higher "Risk Ratio," suggesting that social ads should prioritize showing close friends to maximize ROI.
Critical Insights & Future Directions
The study proves that social advertising is not just about "who you know," but "how well you know them." However, there are limitations:
- Passive vs. Active: This study focused on passive cues (automated text). Active sharing (sending a direct recommendation) likely carries even more weight.
- Privacy & Saturation: As social cues become ubiquitous, "banner blindness" might set in, or users might become sensitive to how their data is used to "sell" to their friends.
Takeaway for Engineers: If you are building a recommendation or advertising system, "Network Proximity" is not enough. You must incorporate dynamic interaction features (like communication frequency) to truly capture the influence structure of the graph.