
Deciphering Digital Democracy: The Power of Relative Support in Electoral Networks
Analyzing the usage of social media during Spanish presidential electoral campaigns
This paper analyzes user behavior and communication patterns on Twitter during the 2011 Spanish presidential elections using complex network theory. It introduces the "Relative Support" (RS) parameter, which utilizes the growth rates of party mentions to accurately reflect and predict electoral outcomes across different European countries.
TL;DR
Researchers have moved beyond simple "mention counting" to predict elections. By analyzing the growth rates of mentions during critical peaks (like televised debates) and applying complex network analysis, this study shows that Twitter acts as a high-fidelity sensor for political reality. The introduced Relative Support (RS) parameter successfully matched the 2011 Spanish election results with near-perfect accuracy (1.54 vs 1.55).
Problem: The "Sarkozy Paradox"
In digital political analysis, "more noise" doesn't always mean "more votes." A classic trap is the volume bias: in the 2012 French elections, Nicolas Sarkozy had a higher total volume of mentions on Twitter, yet he lost. Why? Because raw volume captures both positive and negative attention.
The authors identified that existing methods failed to distinguish between general buzz and actual political momentum. They sought a metric that could filter out the background noise and capture the relative shift in support triggered by real-world events.
Methodology: From Slopes to Social Structures
1. The Relative Support (RS) Parameter
Instead of counting total tweets, the authors looked at the cumulative growth of mentions.
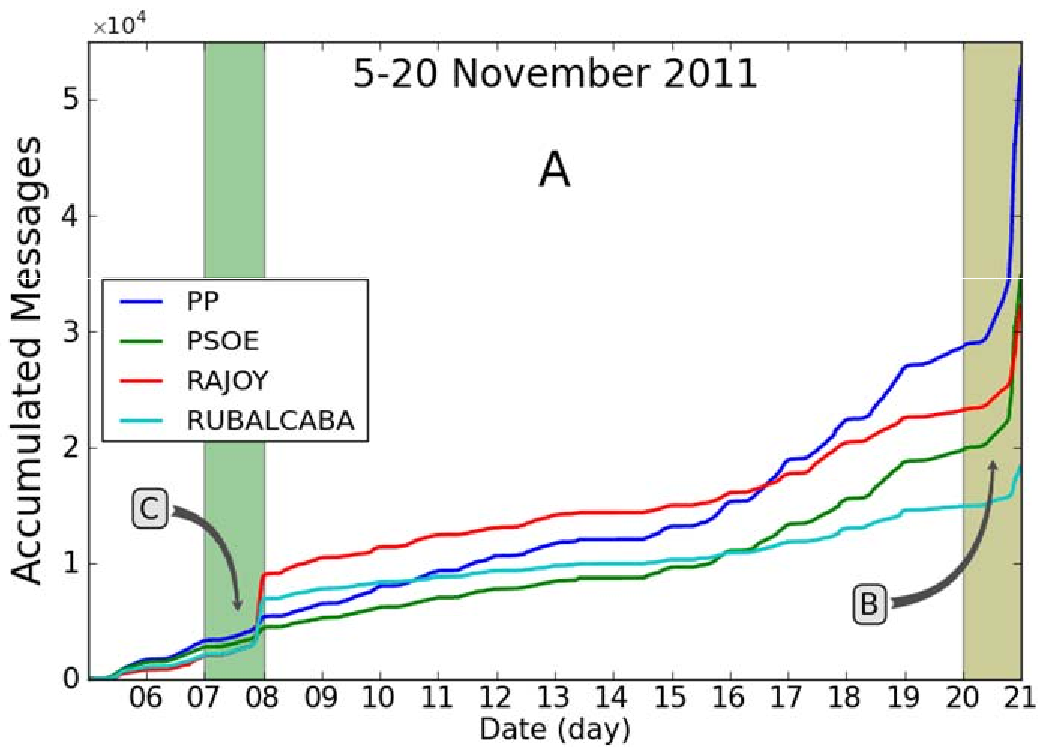
The slope of these lines represents the "intensity" of support. The RS parameter is defined as: This measures which candidate captures more "benefit" from specific offline events in real-time.
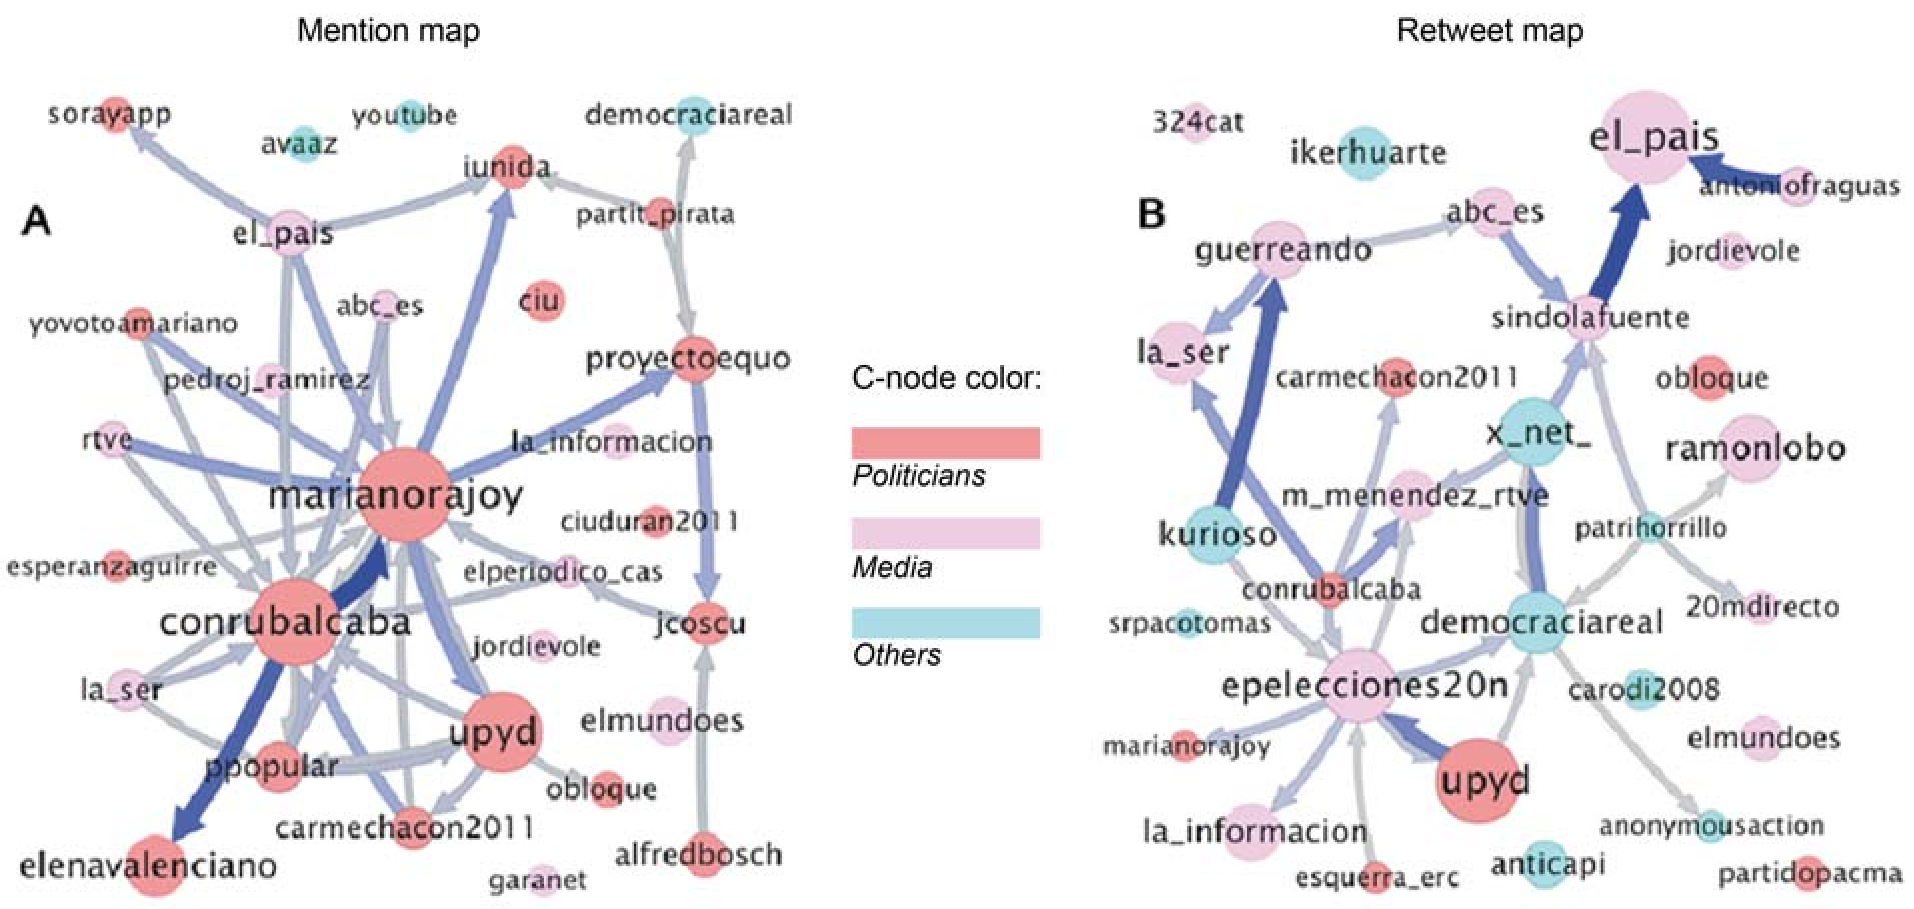
2. Community Detection via MapEquation
To understand how information flows, the authors utilized the MapEquation algorithm. This approach treats information flow as a random walk, where "communities" are regions of the network where a random walker gets trapped. This revealed how users cluster based on ideology.
3. Modeling "Affinity"
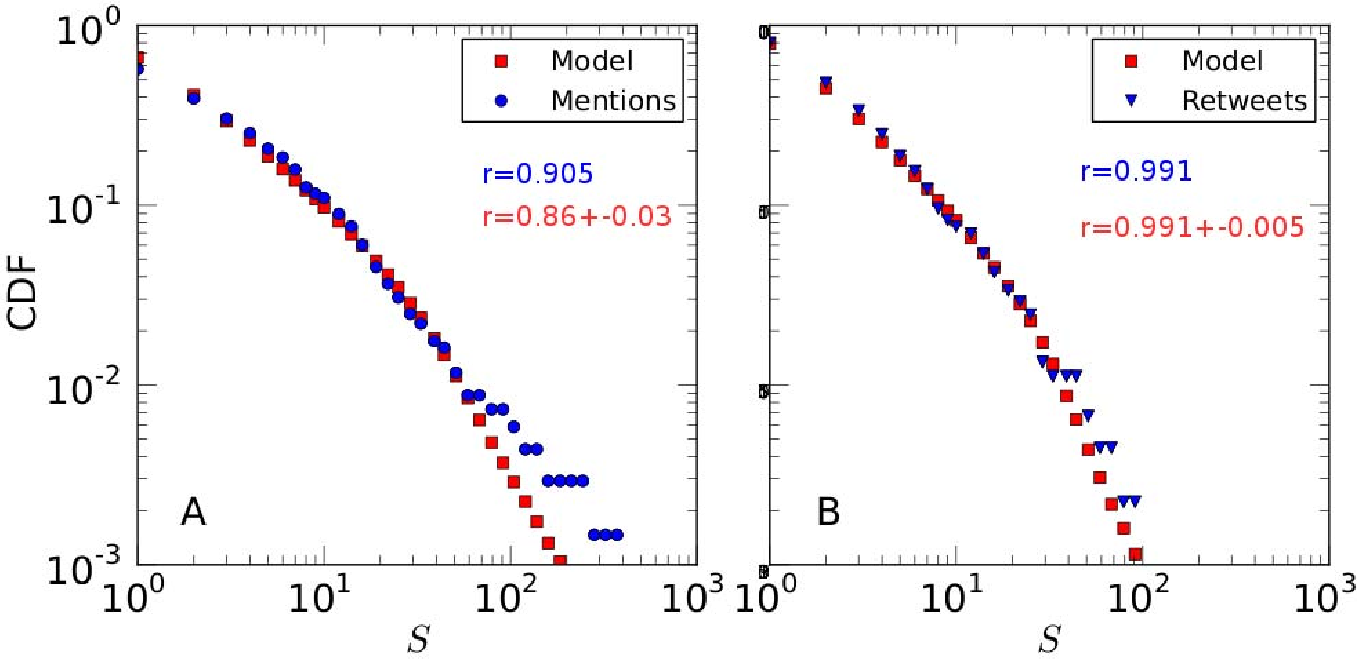
The authors proposed a growth model based on Heterogeneous Preferential Attachment. In this model, the probability of a connection isn't just based on how "famous" (high degree) a node is, but on the affinity () between their political parties.
Results: The Pulse of the Electorate
The findings were striking in their precision:
- Predictive Accuracy: During the Spanish presidential debate, the was 1.54. The final vote ratio was 1.55.
- Polarization: Retweet networks showed an assortativity of 0.991, meaning users almost never retweet across party lines.
- Lack of Dialogue: The mention networks showed very low reciprocity (2.17%). Twitter in politics acts more like a "broadcasting" or "campaigning" tool than a space for cross-party debate.
Critical Insights & Future Outlook
This work highlights a fundamental truth about social media in the political arena: It is an echo chamber of the elite. A very small fraction of users (politicians and media) drives the majority of the conversation.
Takeaways for Researchers:
- Dynamic vs. Static: Focus on the dynamics of time series (slopes) rather than static cumulative totals.
- Affinity Matters: When modeling social networks, political "affinity" is as powerful a force as "popularity" (preferential attachment).
- Neutral Identifiers: Using neutral hashtags (like #20N) is crucial to capturing a representative sample of all ideological sides.
While the RS parameter is powerful, its limitation lies in its dependence on specific "trigger events" (like debates) to provide the most accurate readings. Future work should explore how to maintain this accuracy during "quiet" periods of a campaign.