
Mapping the Invisible Network: How EU Funding Shapes Research Alliances
Social Network Analysis of European Project Consortia to Reveal Impact of Technology-Enhanced Learning Projects
This paper introduces a Social Network Analysis (SNA) approach to evaluate the latent impact of European Technology-Enhanced Learning (TEL) projects funded via FP6, FP7, and eContentplus. By modeling project consortia as organizational networks, it identifies key "bridge" projects and sustained collaboration ties that define the European R&D landscape.
TL;DR
Is European research funding just about delivering reports, or is it about building a lasting scientific "social fabric"? This paper uses Social Network Analysis (SNA) to reveal that the real impact of TEL projects lies in the sustained collaboration ties between organizations. By analyzing 77 projects (FP6, FP7, eContentplus), the authors identify which projects acted as "power brokers" and which institutions are the true centers of gravity in the European Learning Technology space.
Beyond Benchmarks: The Motivation for Structural Analysis
The European Commission has invested hundreds of millions of euros into Technology-Enhanced Learning (TEL). Traditionally, "impact" is measured by counting papers or software prototypes. However, the authors argue that the latent impact—the professional relationships that survive long after a project's funding ends—is equally important.
The challenge is that these patterns are invisible to the naked eye. By treating project consortia as a social network, we can see how knowledge "flows" from the past (FP6) through intermediaries (eContentplus) into the future (FP7).
Methodology: The Science of "Bridges"
The study transforms project data into a directed graph. Each node is a project, and the edges signify the temporal progression: an edge points from an older project to a newer one if they share partner organizations.
1. Project-Level Centrality
The researchers used Betweenness Centrality to find "bridge" nodes. A project with high betweenness acts as a transit point for expertise.
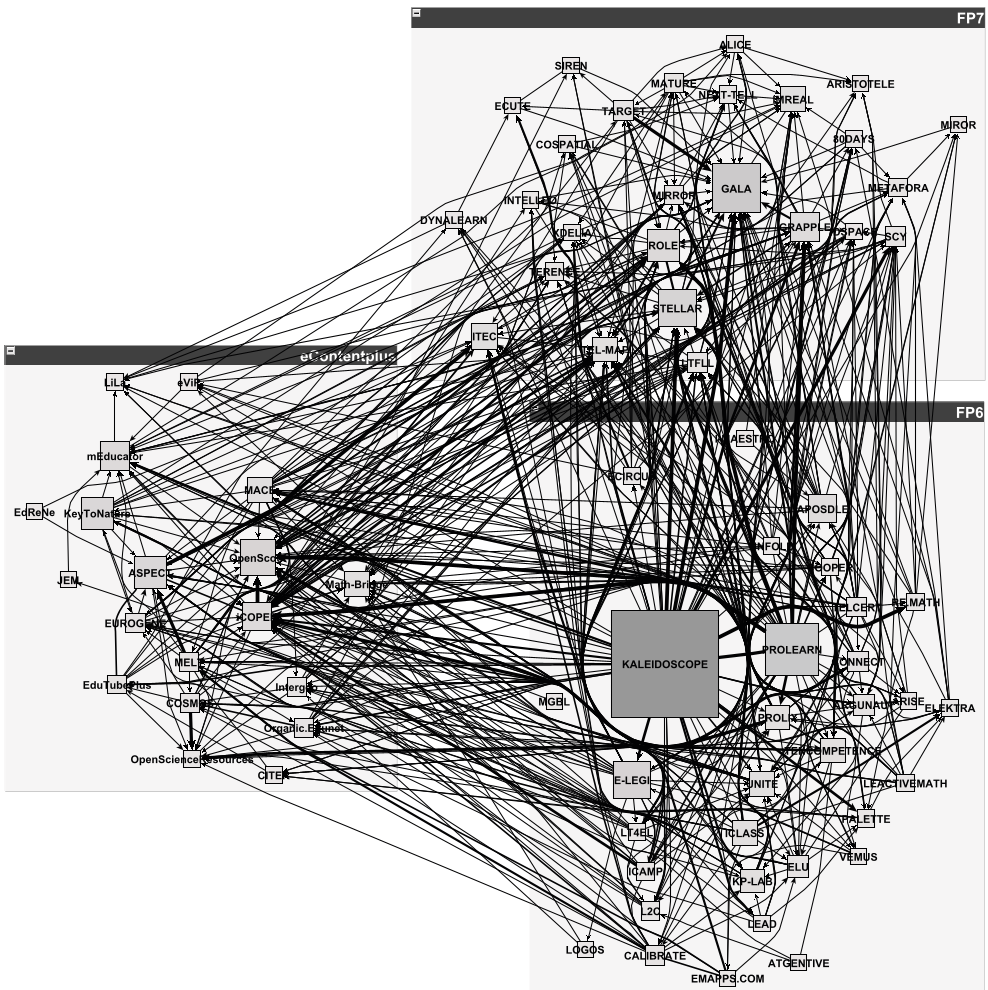 Figure 1: Visualization of the social network of TEL projects. Node size reflects betweenness centrality.
2. Organizational Evolution
By analyzing 9,330 distinct collaboration pairs among 604 organizations, the authors applied PageRank (the same algorithm Google used to rank websites) and Clustering Coefficients to identify which institutions are not just "joiners," but "multipliers" in the network.
Critical Findings: Size vs. Sustainability
The results provide a fascinating look at the "politics" of research consortia:
- The Funding Gap Bridge: The eContentplus (ECP) program was identified as a vital "broker." When FP6 funding stalled before FP7 ramped up, ECP projects (like OpenScout and ICOPER) maintained the momentum, carrying over partners and keeping the community intact.
- Efficiency of NoEs: Networks of Excellence (NoEs) are designed to integrate research. The data shows they work. Participating in an NoE significantly boosts an organization's PageRank.
- The Paradox of KALEIDOSCOPE: Interestingly, while the KALEIDOSCOPE project was the largest node (due to its 83 partners), the PROLEARN project was actually more successful at creating strong, sustained ties. This suggests that massive consortia might be too large for deep, repeated collaboration, whereas mid-sized strategic alliances lead to more permanent partnerships.
Collaboration Leaders
The table below highlights the diversity of projects analyzed, from early FP6 initiatives to the then-current FP7 calls.
 Table 1: The dataset spanning various funding calls and project types.
Deep Insight & Conclusion
This paper shifts the perspective from project outputs to network resilience. The takeaway is clear: the value of an EU project isn't just the final PDF report; it's the "trust infrastructure" it builds.
Key Lessons:
- Intermediate programs are essential for bridging the "funding valleys" between major cycles.
- Integrated Projects (IPs) are the engines of regional R&D, showing higher ratios of favorable PageRank vs. clustering.
- For organizations, the goal shouldn't just be to join a project, but to find "central" partners (like Open University or Katholieke Universiteit Leuven) who have a history of repeated, multi-project collaborations.
Future Outlook: As we move into even more complex AI-driven research, using SNA to design "optimal" consortia—rather than just analyzing them after the fact—could be the next frontier in research management.