
Unmasking the Power Map: A Social Network Analysis of South Korea's Auto Industry
Social Network Analysis of a Supply Network Structural Investigation of the South Korean Automotive Industry
This paper performs a Social Network Analysis (SNA) on the South Korean automotive industry using data from 275 companies to map a network of 395 entities. It utilizes centrality metrics (Degree, Betweenness, Closeness) to identify key structural players beyond traditional market share metrics, providing the first large-scale empirical SNA application to a national automotive supply network.
TL;DR
This research moves beyond simple buyer-supplier lists to map the "Industrial DNA" of South Korea’s automotive sector. By treating 395 companies as nodes in a social network, the study uses mathematical centrality metrics to pinpoint which companies truly control the flow of materials and information, revealing that market share isn't the only measure of industrial power.
Beyond the Hierarchy: Why Linear Chains Are Obsolete
For decades, we’ve viewed supply chains as straight lines: Raw Materials → Parts → Assembly → Customer. However, modern manufacturing is a complex web. A single supplier might serve five different competitors, creating hidden dependencies.
The author argues that traditional linear analysis misses the structural embeddedness—the way a company's strategic behavior is limited or empowered by its position in the network. The challenge? Gathering enough data to map an entire country’s industry and finding a way to translate "social" metrics (like popularity) into "industrial" metrics (like operational criticality).
Methodology: The Math of Manufacturing
The study leverages data from the Korean Auto Industries Cooperative Association (KAICA). It models the industry using two types of graphs:
- Directed Networks: Flow of materials (Who supplies whom).
- Undirected Networks: Collaborative and contractual ties.
The core of the analysis rests on three pillars of Centrality:
- Degree Centrality: The number of direct connections. High degree = High operational load.
- Betweenness Centrality: How often a company acts as a bridge between others. High betweenness = A "gatekeeper" or a potential bottleneck.
- Closeness Centrality: How "near" a company is to all others. High closeness = High autonomy and resource access.
 The hierarchical structure of the Korean auto industry at scale, visualized via Gephi.
Key Insights: Visibility vs. Reality
The results confirm some intuitions while challenging others:
1. The "Hidden" Influence of GM and Tier-1s
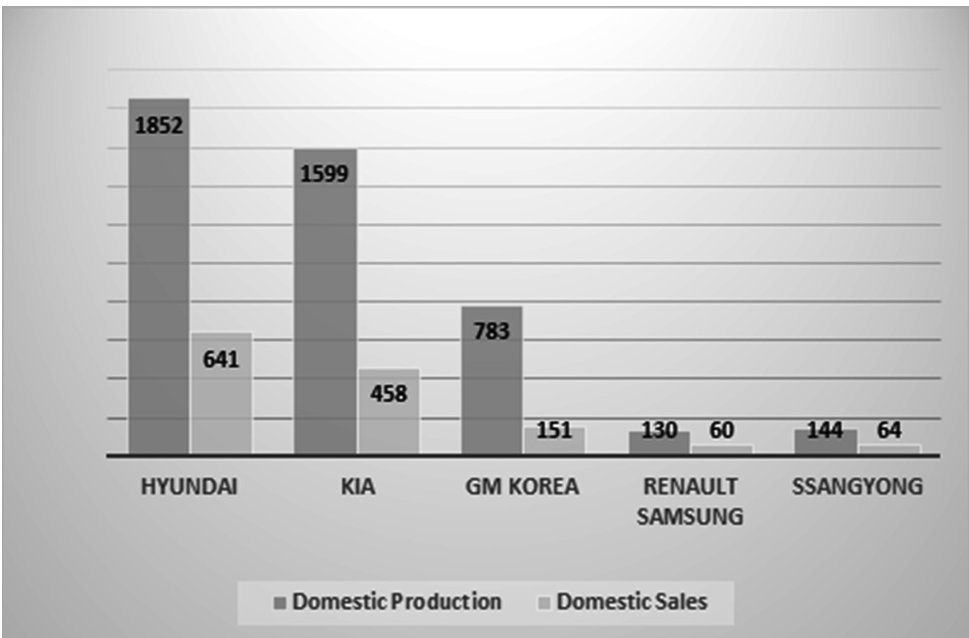
While Hyundai-Kia dominates production volume (76%), SNA metrics show that GM Korea and specialized suppliers like Mando and Delphi possess much higher structural importance than their production numbers suggest. They serve as vital nodes that connect disparate parts of the network.
2. The Rise of the Module Supplier
Hyundai Mobis emerges as a central figure, nearly rivaling the final assemblers in centrality. This reflects the industry shift toward "module-based production," where tier-1 suppliers take over complex system integrations, becoming the "operational heart" of the network.
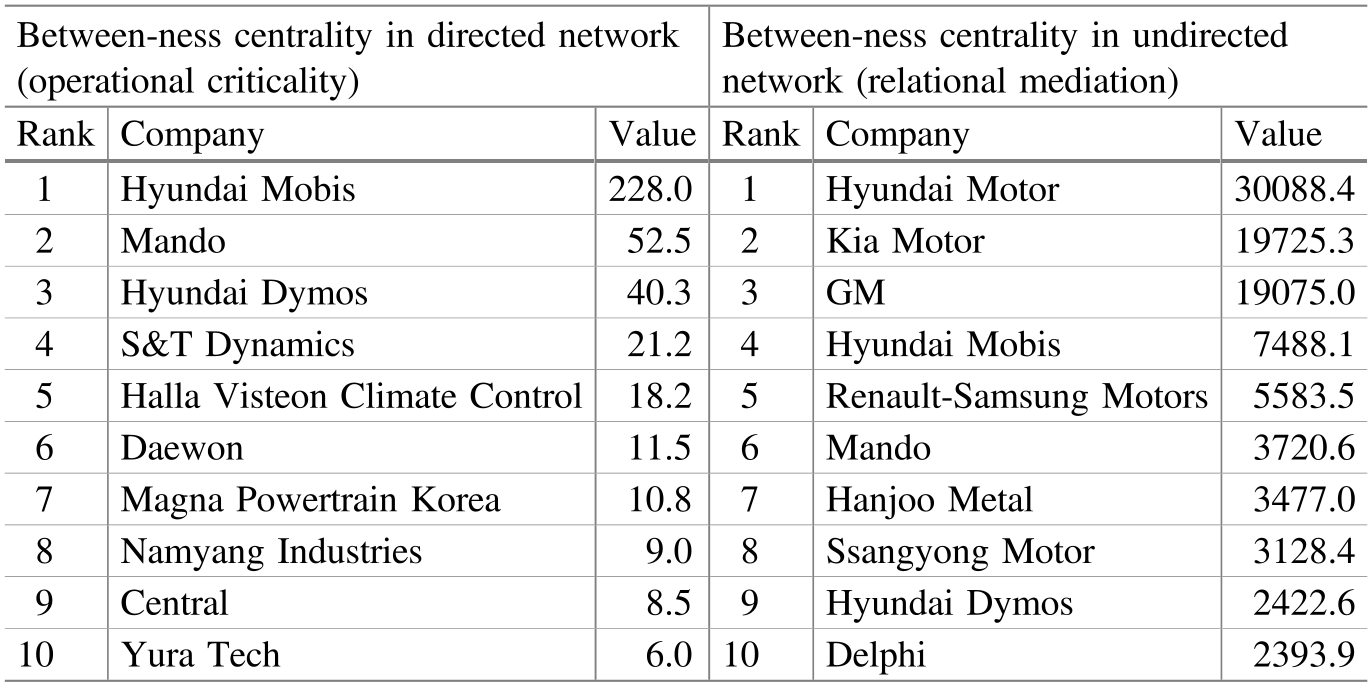 Table showing Betweenness Centrality: Notice how specialized parts manufacturers like S&T Dynamics and Halla-Visteon rank surprisingly high as critical bridges.
Deep Insight: Operational Criticality
One of the most profound takeaways is the validation of Betweenness Centrality as a proxy for Operational Criticality. If a company with high betweenness fails (e.g., due to a strike or financial crisis), the entire network is at risk of fracturing because there are few alternative paths for information or materials to flow.
Critical Analysis & Future Outlook
Limitations: The study admits to "Sampling Bias." By focusing on KAICA members, it potentially misses non-traditional players—specifically IT and Electronics companies (like Samsung Electronics or LG Chem). As cars become "computers on wheels," the exclusion of the tech sector is a significant gap.
The Future: The author suggests that future SNA research should focus on Globalization. Companies are no longer domestic; a supplier in Busan might be more influenced by a buyer in Detroit than one in Seoul. Mapping these cross-border "Super-Networks" is the next frontier for industrial resilience.
Conclusion
This paper serves as a vital bridge between sociology and industrial engineering. It proves that to understand an industry, we must stop looking at companies in isolation and start looking at the gaps—and the bridges—between them.