
The Social Fabric of Competition: Decoding the Kaggle Crowd Network
Social network of the competing crowd
This paper investigates the social network dynamics of the Kaggle competition platform by modeling interactions between members and teams as a bipartite graph. The study characterizes the unique structural properties of this "competing crowd" and compares them with traditional affiliation networks such as scientific co-authorship and movie actor databases.
TL;DR
Unlike Facebook or LinkedIn where the goal is to maximize connections, the social network of Kaggle is defined by competition. This study reveals that the "Competing Crowd" forms a highly fragmented network of thousands of tiny, dense islands rather than one big continent. While these networks follow power-law distributions, the largest connected component represents less than 5% of the community, highlighting a "dense but local" connectivity pattern unique to crowdsourcing.
Problem & Motivation: The Limits of Traditional Connectivity
In most large-scale social networks, researchers look for the Giant Connected Component (GCC)—the idea that everyone is eventually linked to everyone else. In professional or social settings, this "Small World" effect is driven by the desire to expand one's reach.
However, the authors argue that Kaggle is a different beast. Because participants are competing for prizes and rankings, the Inductive Bias of the network is toward isolation or small-team secrecy. Existing methods that project bipartite (member-to-team) graphs into one-mode (member-to-member) graphs often "inflate" the importance of nodes and lose the nuances of why teams form. The goal of this paper is to uncover the specific topological fingerprint of a community where competition is the primary driver of interaction.
Methodology: Bipartite Projection and Bipartite Statistics
The researchers treated Kaggle's structure as a Bipartite Graph (or Affiliation Network). In this model:
- Mode 1 (Top): Teams
- Mode 2 (Bottom): Individual Members
- Edges: Exist only between a member and a team they joined.
To analyze this, they performed two types of projections:
- TT (Team-Team) Network: Two teams are linked if they share a member.
- MM (Member-Member) Network: Two members are linked if they served on the same team.
The Architecture of Affiliation
The authors utilized extended statistics to avoid the "degree inflation" common in one-mode projections. One key metric is the Redundancy Coefficient, which measures how often neighbors of a node are connected to each other through different entities.
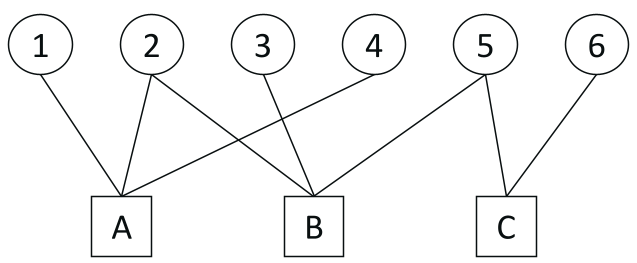 Fig 1: Bipartite representation of Member-Team affiliations.
Experiments & Results: Islands in the Stream
The data science community at Kaggle showed several striking characteristics:
1. Power-Law Everything
Both the size of teams and the number of competitions entered by members follow a Power-Law distribution. A few "super-users" join many teams, while the vast majority join only one.
2. Extreme Fragmentation
The most significant finding is the sparsity. In Table I, we see that while the TT network has a clustering coefficient of 0.9809, its density is a mere 0.0004. This means that if you are in a component, you are likely part of a Clique (a sub-graph where everyone is connected), but you are disconnected from 95% of the rest of the site.
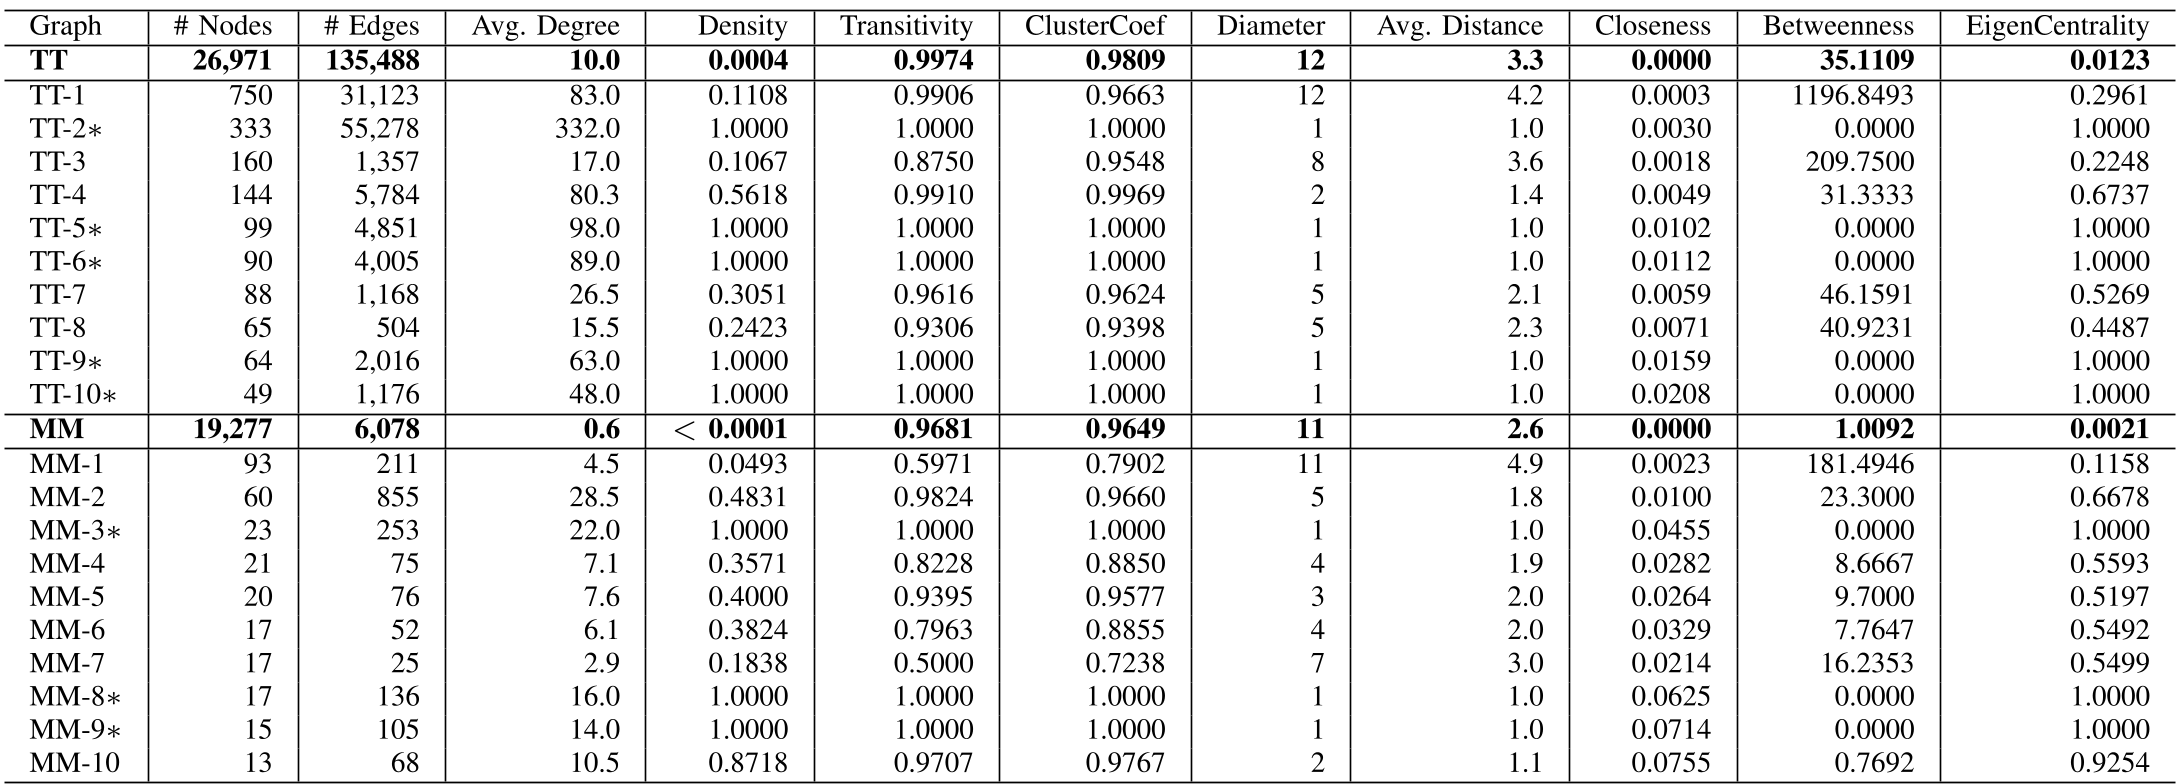 Table 1: Comparison of Team-Team (TT) and Member-Member (MM) network statistics.
3. Comparison with Other Domains
When compared to "Authoring" (scientific papers) or "Actor-Movie" networks, the Kaggle crowd is much more isolated. In scientific research, authors often bridge different groups through co-authorship over years. In Kaggle, teams are often ephemeral and purpose-built for a single competition, leading to a much lower Average Distance within the components (often exactly 1.0, signifying a "star" or "clique" structure).
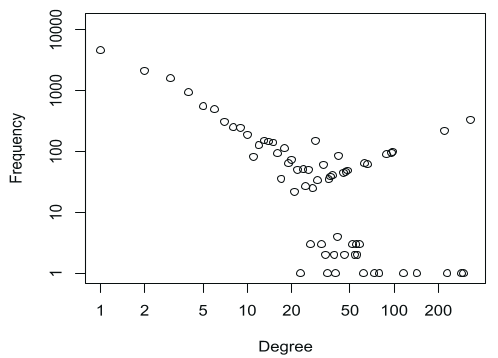 Fig 2: The power-law distribution of connected component sizes.
Critical Insight & Conclusion
Why this matters
This paper proves that competition acts as a social barrier. While crowdsourcing platforms like Kaggle are "communities," they do not behave like "social networks." The structural integrity of the network relies on high-density, low-reach clusters.
Limitations & Future Work
The study is primarily descriptive. While it beautifully maps the structure of the network, it doesn't yet link that structure to success. The authors note that the next step is to determine if "bridging" nodes (members who join multiple teams across different topics) perform better than "isolated" elites.
Final Takeaway: In a competing crowd, the social graph is a collection of silos. If you want to understand professional crowdsourcing, stop looking for the "Giant Component" and start looking at the "Cliques."