
Reconstructing the Invisible: How to Build Social Graphs from Anonymous Call Records
Reconstruction of a social network graph from incomplete call detail records
This paper introduces an algorithm to reconstruct social network graphs from incomplete Call Detail Records (CDR) where caller information is missing. By employing an affiliation network model and a bipartite graph approach, the authors successfully map interpersonal connections among over 290,000 customers of a wired telephony operator.
TL;DR
Researchers have developed a method to reconstruct social networks from "incomplete" Call Detail Records (CDR) where the caller IDs are missing. By using an affiliation network approach—connecting users who call the same set of numbers—they successfully recovered a graph of ~280,000 nodes that perfectly mimics real-world social dynamics, including "Small World" properties and power-law distributions.
Context & Motivation: The Privacy Paradox
In the telecommunications industry, Call Detail Records (CDRs) are gold mines for understanding customer behavior. However, privacy laws often force operators to anonymize or strip data. In this study, the authors faced a specific challenge: they had customer IDs for the "caller" side but only scrambled, non-mappable IDs for the "callee" side.
The central problem: How do you build a social graph when you don't know who is calling whom?
Methodology: The Affiliation Insight
The authors pivoted from direct peer-to-peer mapping to a Bipartite Affiliation Graph. Instead of looking for a direct link between Customer A and Customer B, they looked for shared "affiliation objects"—the phone numbers being called.
The Algorithm
- Filtering: Excluded business users and bots (those making >24 calls/day) to focus on human interpersonal relations.
- Top-r Selection: For each customer, they identified a ranked list of the most frequently called numbers.
- Edge Construction: A link is created between two customers if they share at least one number in their top- lists.
The strength of the algorithm lies in its sensitivity parameter . While higher values increase graph density, the authors found that or provided a stable representation of social reality without introducing "inhuman" levels of connectivity.
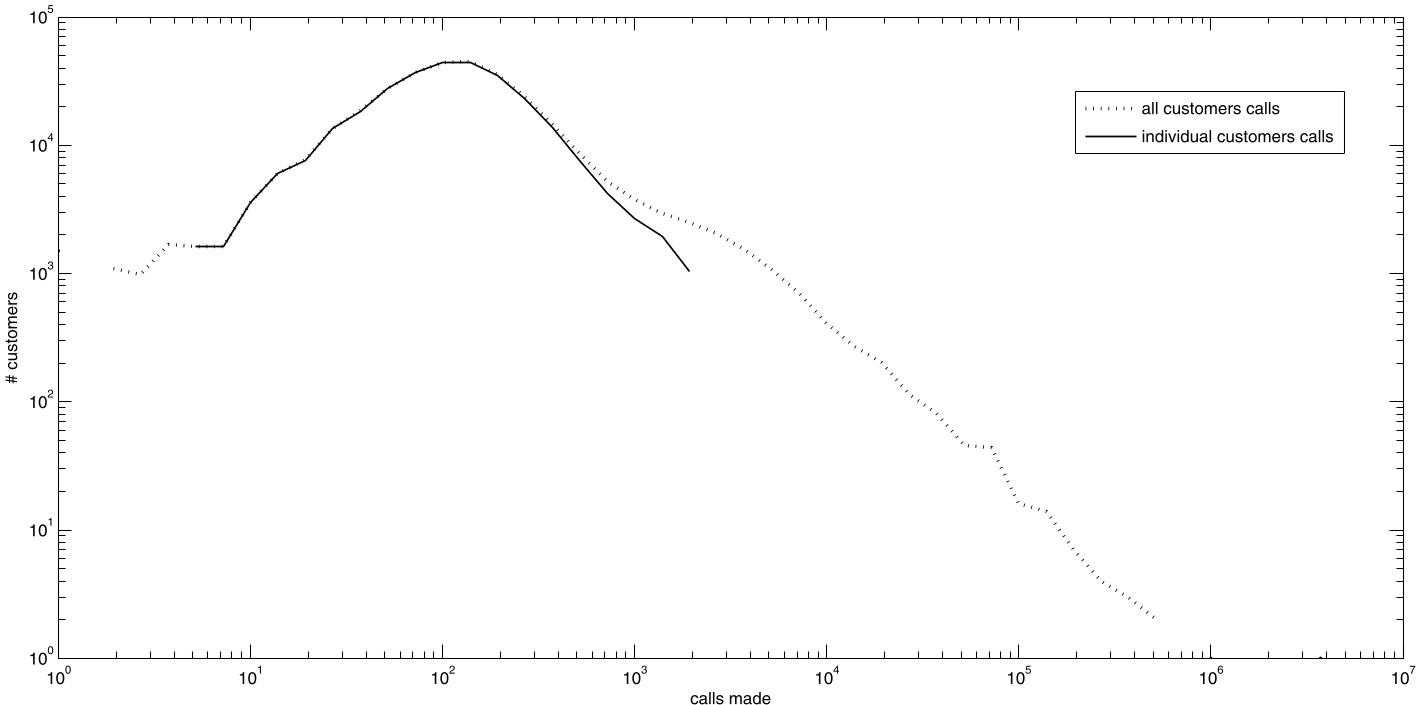 Figure 1: Histogram showing the distribution of calls after filtering out non-human/business patterns.
Experiments: Validating the "Socialness" of the Graph
To prove the reconstructed graph wasn't just random noise, the authors compared its statistical signature against known social network benchmarks.
1. Power-Law Distribution
The reconstructed network showed a clear power-law degree scaling (where few nodes have many connections, and many have few). This is a hallmark of human-driven networks.
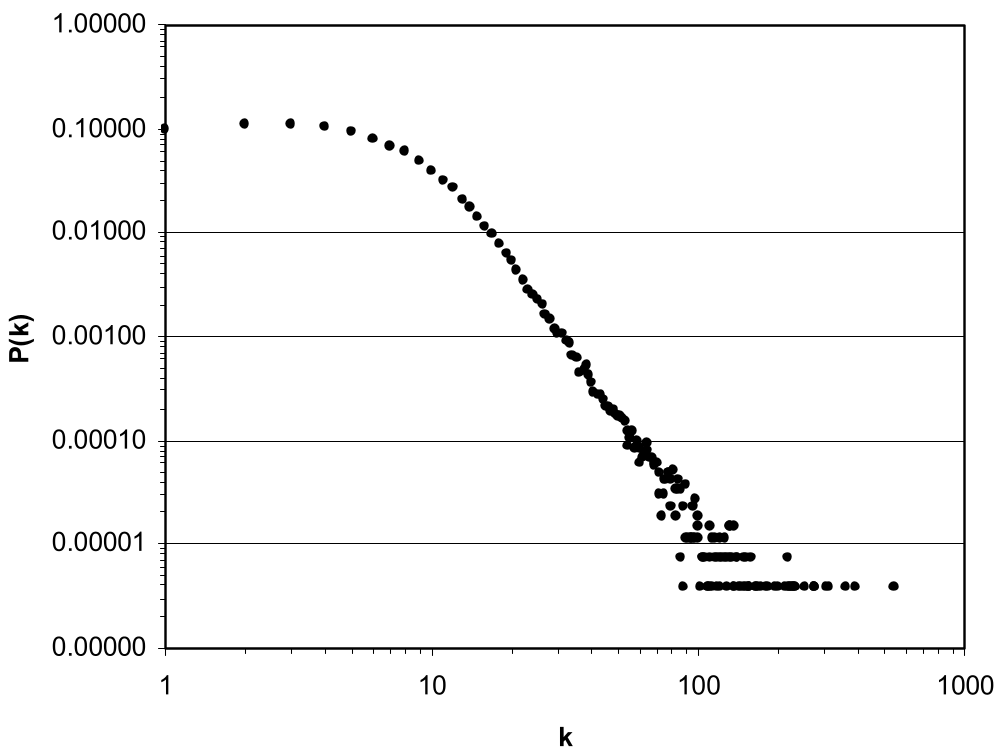 Figure 2: Power-law node degree scaling, proving the graph follows social organizational norms.
2. The Small World Phenomenon
The graph exhibited a mean distance of 6.83 between nodes. This aligns remarkably well with Milgram’s famous "six degrees of separation" theory, suggesting the affiliation method captures the underlying connectivity of society.
3. Preferential Attachment
By analyzing data dynamics from October to December, the authors observed that new users joining the network were more likely to connect to already well-connected nodes. This confirms the Barabási-Albert mechanism, a fundamental principle of how real social networks grow.
| Network Type | Mean Degree (k) | Clustering (c) | Exponent (α) |
|---|---|---|---|
| Reconstructed (r=5) | 7.02 | 0.24 | 2.75 |
| IP Network | 5.98 | 0.18 | 2.5 |
| Actors | 113.00 | 0.79 | 2.3 |
Critical Insight & Industry Value
The study demonstrates that structural dependencies are incredibly resilient. Even when an operator tries to protect privacy by scrambling IDs, the mathematical fingerprints of human relationships remain.
Why this matters for Industry:
- Churn Prediction: If a "central" node in a community leaves the provider, their neighbors are likely to follow. This graph allows operators to identify those influential nodes.
- Viral Marketing: Targeting "hubs" (nodes with high betweenness centrality) is more efficient than mass advertising.
- Tariff Design: Understanding "cliques" helps in creating family or group plans that reflect actual social habits.
Conclusion
This research provides a robust framework for recovering hidden social structures from sparse metadata. While it successfully validates the "reconstruction" through statistical alignment, the authors note that future work should incorporate temporal patterns—the timing of calls—to further refine the accuracy of these inferred relationships.