
SNM: Redefining Crowd Anomaly Detection through Social Network Graphs
Social network model for crowd anomaly detection and localization
The paper introduces the Social Network Model (SNM), an unsupervised framework for detecting and localizing crowd anomalies using spatio-temporal cuboids. By modeling local interactions as social networks (LSN) and aggregating them into a Global Social Network (GSN), the method achieves SOTA performance in identifying rare behavioral patterns.
TL;DR
The Social Network Model (SNM) treats individuals in a crowd not just as moving particles, but as nodes in a dynamic social graph. By analyzing the "closeness" of these nodes across hierarchical spatio-temporal cuboids, the system can autonomously identify abnormal events like skaters on pedestrian paths or sudden panics with higher accuracy (86.7% AUC) than traditional social force or texture-based models.
Background Positioning
In the spectrum of computer vision, crowd analysis typically oscillates between Object-based (tracking individuals) and Holistic-based (treating the crowd as a fluid). SNM finds a "sweet spot" by employing an unsupervised graph-based approach. It is a benchmark-improving work that refines how we define "normal" behavior through social connectivity rather than just simple motion vectors.
Problem & Motivation: The Contextual Gap
Why do current systems miss a bicyclist in a crowd? Often, the bicyclist's speed might be "normal" for a vehicle, or their direction "normal" for the path. The failure lies in contextual anomaly detection. Existing methods like Social Force Models (SFM) are often computationally heavy and struggle with inconsistent trajectories in dense scenes. The authors argue that an anomaly is essentially a "social outlier"—a node that fails to form a significant cluster with its neighbors when evaluated through direction, velocity, and curvature.
Methodology: From Cuboids to Social Clusters
The SNM framework operates in four distinct phases:
1. Spatio-Temporal Partitioning
The video is sliced into 3D "cuboids." The system uses a multi-resolution approach—the denser the crowd, the finer the granularity (from 2x2 to 8x8 divisions).
2. Feature Extraction & Similarity
Instead of fragile long-term tracking, the model uses KLT tracklets (short-duration point trajectories). It computes similarity based on:
- Cosine & Magnitude Similarity: Orientation and path length.
- Velocity & Curvature: Using Dynamic Time Warping (DTW) to capture the "rhythm" of movement and sudden changes in direction.
3. Building the Social Network
Each tracklet represents a node. An edge is drawn if two tracklets are socially similar.
- LSN (Local Social Network): Formed within individual cuboids.
- GSN (Global Social Network): Formed by merging similar LSNs across the entire frame.
 Figure: The pipeline from video input to social network-based anomaly localization.
4. Anomaly Identification
Anomaly detection is elegant: any cluster that is significantly smaller than the "dominant" cluster (the primary social group) is flagged. If your "social network" has only two nodes while everyone else is in a cluster of fifty, you are an anomaly.
Experiments & Results: SOTA Performance
The model was tested on the UCSD and UCD datasets, which feature real-world scenarios like bikers on sidewalks and students moving against the flow.
Key Performance Metrics:
- AUC Performance: SNM achieved 86.7%, beating competitive methods like MDP (84.8%) and Sparse Reconstruction (86.1%).
- Localization Precision: In pixel-level tests, SNM's rate of detection surpassed all baselines, effectively "tightening" the mask around abnormal objects compared to the "blobs" produced by Mixture of Dynamic Textures (DTM).
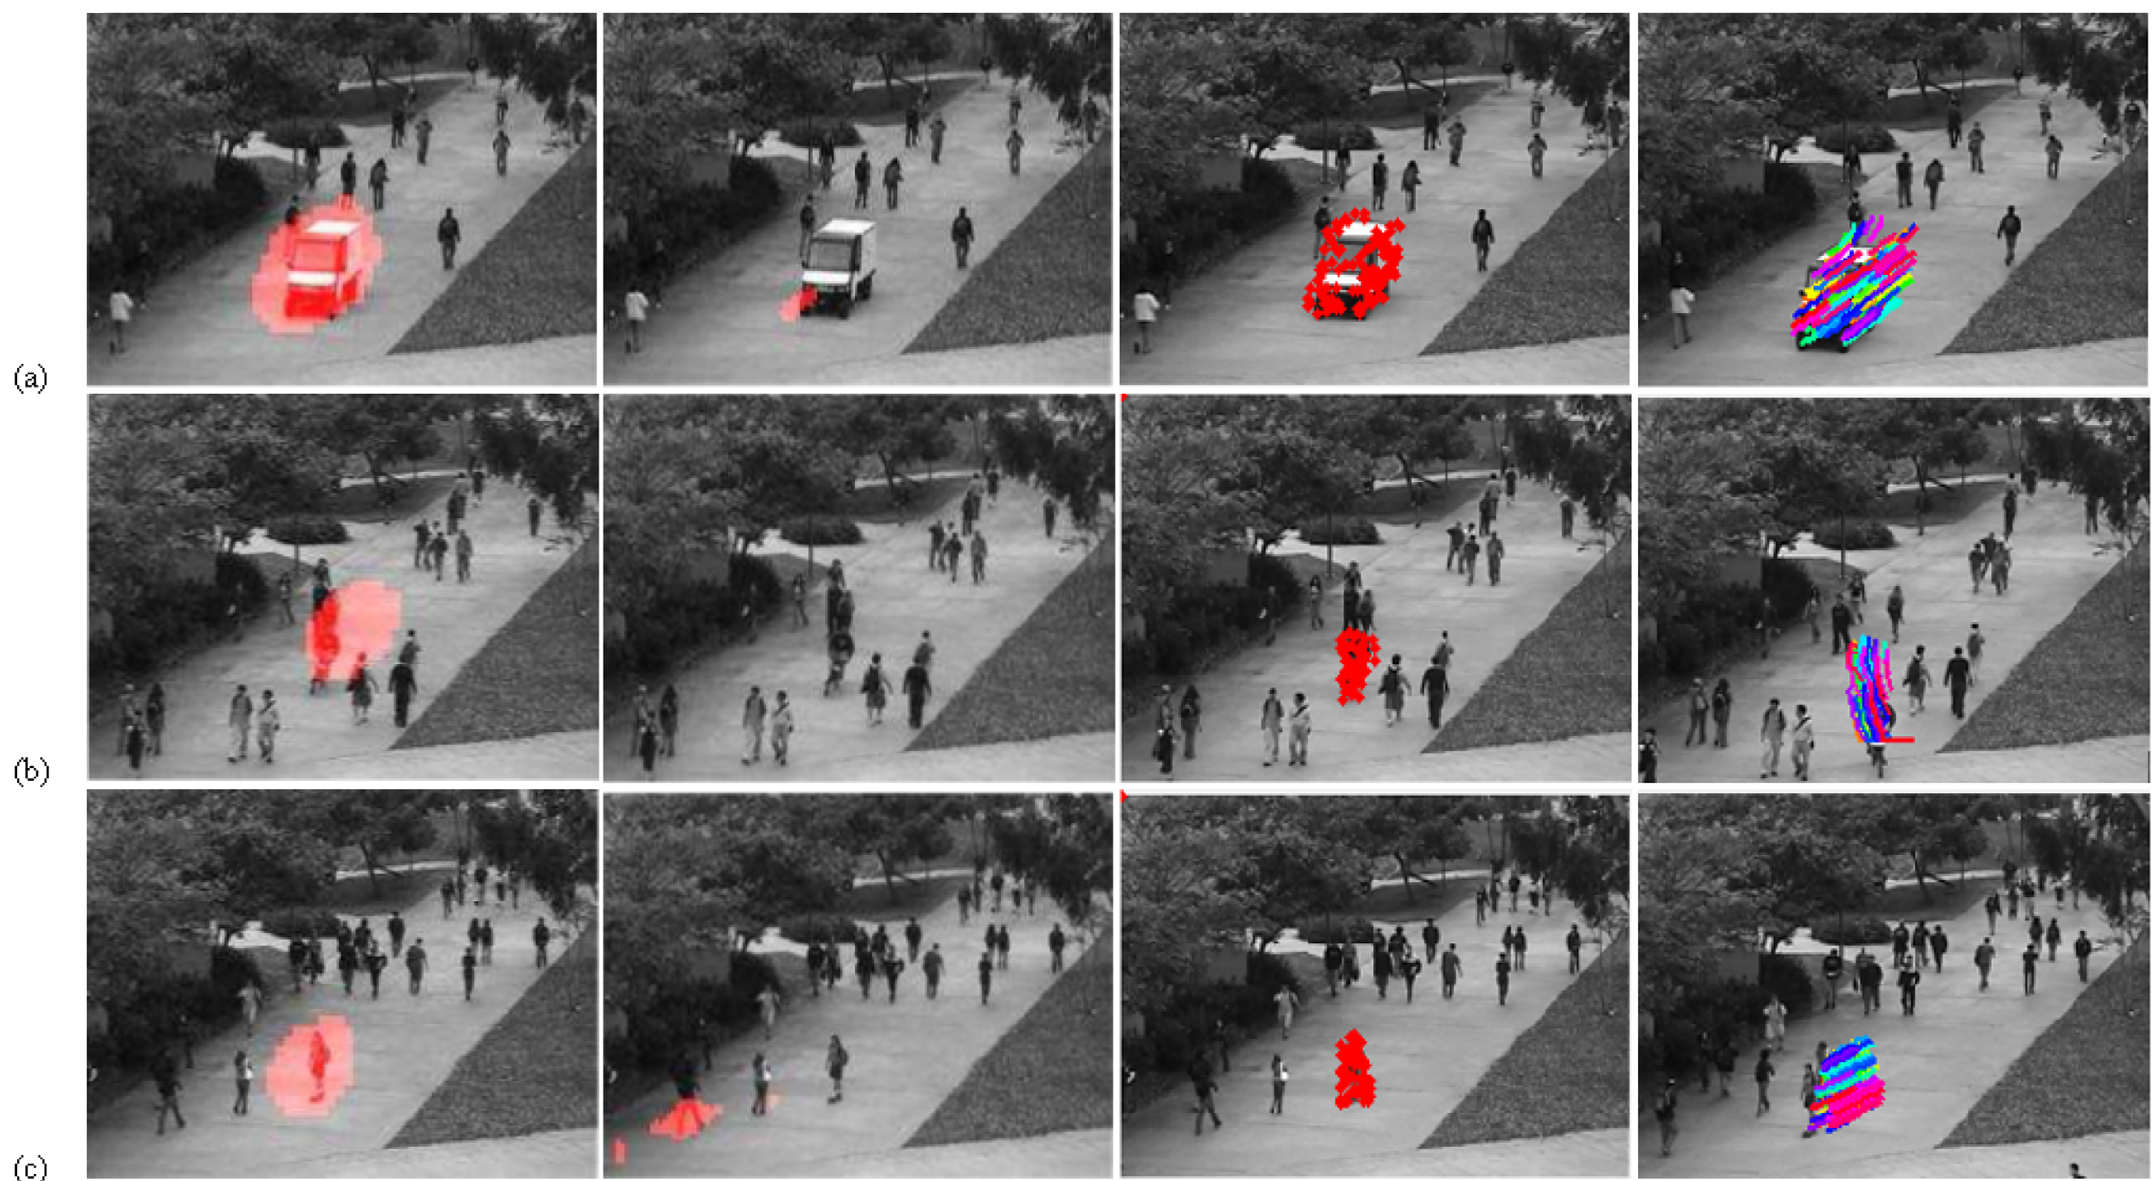 Figure: Comparison of anomaly masks. SNM provides a much precise localization of abnormal objects (bikers, skaters) compared to DTM and MPPCA+SF.
Ablation: The Power of Scale
The authors proved that 8x8 partitioning consistently outperformed 2x2, particularly in dense scenes, as higher granularity allows the social graph to capture finer interaction nuances.
Critical Analysis & Conclusion
Takeaway
The genius of SNM lies in its unsupervised nature and its use of Graph Centrality. It doesn't need to know what a "bike" looks like; it only needs to know that the bike's motion doesn't "bond" with the pedestrian motion around it.
Limitations
- Computational Latency: While more efficient than some, DTW and hierarchical clustering on 8x8 grids still pose challenges for ultra-high-resolution real-time feeds without GPU acceleration.
- Parameter Sensitivity: The weights () for balancing velocity vs. curvature are determined experimentally, which might require tuning for vastly different environments (e.g., a quiet park vs. a chaotic subway).
Future Outlook
As we move toward Smart Cities, the SNM approach could be integrated with Edge Computing. By offloading the "Cuboid" analysis to local cameras and only sending "Global Social Outliers" to the cloud, we can build massive, privacy-preserving surveillance nets that focus on behavior rather than individual identities.