
Strategic Centrality: Predicting Corporate Success via Network Trajectories
Social networks analysis: a game experiment
2010-05-14
Summary
Problem
Method
Results
Takeaways
Abstract
The paper explores the longitudinal evolution of business networks through a controlled game simulation (INTOP Mark/2000). It introduces the "Centrality Trajectory" method to categorize nodes based on early-stage collaboration patterns, achieving a significant correlation between early centrality and final financial performance.
## TL;DR
Is business success a result of internal capabilities or the web of relationships a company weaves? This paper argues for the latter, demonstrating through an extensive game simulation that a company's "Centrality Trajectory" in its first two years can predict its profit by year six. Specifically, companies that maintain high connectivity early on outperform the average by over 100%.
## Behind the Motivation: Why Networks Evolve
In the classic academic debate, some argue that firms gain an edge through internal resources (Resource-Based View), while others point to industry structure. This study shifts the focus to **Social Capital**. The core pain point addressed is the *predictive gap*: we know networks matter, but we haven't been able to accurately categorize how early-stage behavior (the first few interactions) ripples through a system to create winners and losers.
## Methodology: The Centrality Trajectory
The researcher utilized the *International Operations Simulation (INTOP) Mark/2000*, a high-fidelity environment where MBA candidates managed hi-tech firms.
### Defining the Energy Levels
The study introduces four types of trajectories based on the **Degree** (number of ties) compared to the network average:
* **High Energy**: Consistently above average collaboration.
* **Increasing Energy**: Starting low but ramping up connectivity.
* **Declining Energy**: Starting strong but losing ties (often due to conflict or withdrawal).
* **Low Energy**: Persistent isolation.
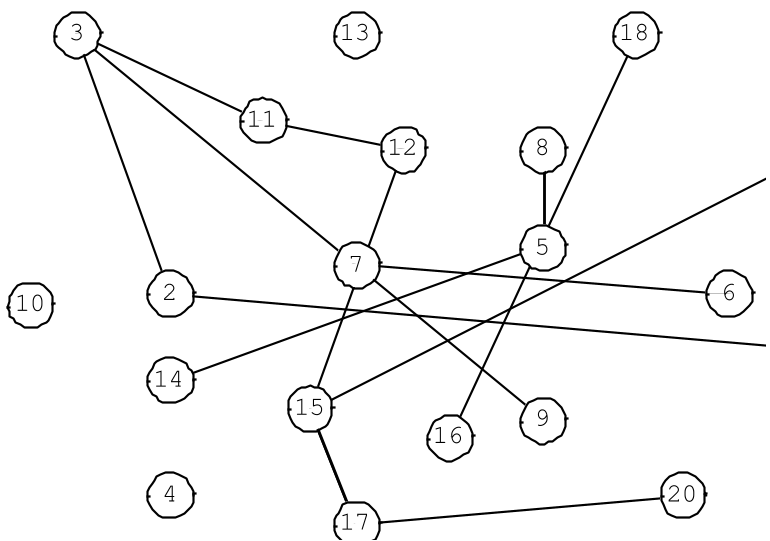
*Figure 1: The initial fragmented network (Stage 1) vs. the complex, dense ecosystem at the game's end (Stage 6).*
## Experimental Results: The High Cost of Isolation
The data reveals a stark reality: early isolation is often a death sentence for profitability.
| Trajectory Type | Relative Net Profit Effect |
| :--- | :--- |
| **High Energy** | **+100.4%** |
| **Increasing Energy** | +3.8% |
| **Low Energy** | -38.1% |
| **Declining Energy** | -53.3% |
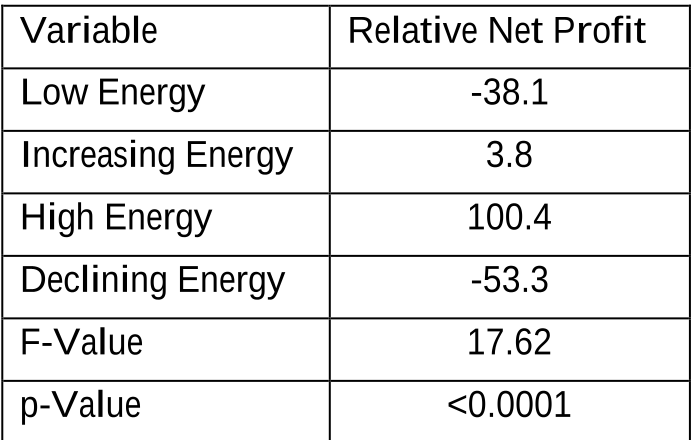
*Table 1: The correlation between early interaction strategies and ultimate financial performance.*
The most striking insight is that **Declining Energy** is worse than being consistently **Low Energy**. This suggests that losing social capital and breaking alliances is more damaging than never having them at all, likely due to the costs of conflict or the loss of critical supply chain dependencies.
## Critical Analysis: Is Centrality Always Good?
The author notes that while the "High Energy" strategy is clearly superior, only **20% of participants** successfully followed it. Why?
1. **Cognitive Load**: Managing many alliances is difficult.
2. **Risk of Rivalry**: Close proximity to competitors in a network increases the chance of intra-alliance friction.
3. **The "Differentiator" Trap**: Some firms intentionally held back to "stand out," only to find themselves isolated and locked out of the flow of resources.
### Limitations
As a laboratory experiment using MBA students, the simulation—while realistic—operates on a condensed timeline. In the real world, "stages" aren't fixed years, and new players enter the market mid-stream, which might disrupt the predictability of the trajectories.
## Conclusion: The Roadmap to Social Capital
The takeaway for modern tech leaders and researchers is clear: **Network position is a precursor to profit.** Companies should focus on:
* Establishing "High Energy" partnerships early.
* Bridging "Structural Holes" to act as a pivot point between different communities.
* Avoiding the "Declining Energy" trap by maintaining and nurturing existing alliances rather than letting them wither.
Future research in this domain likely lies in **Automated Network Analysis**, using AI to monitor these trajectories in real-time to provide "early warning signs" for failing corporate strategies.