
The Geography of Connection: How Social Networks Shape Our Cities
Social Networks and Interactions in Cities ∗
This paper introduces a theoretical framework merging social network analysis with urban economics, utilizing the Katz–Bonacich centrality measure to model non-market interactions. It demonstrates that an agent's equilibrium interaction level is determined by their position in a social network and their geographic proximity to an interaction center.
TL;DR
Why do certain people flock to the city center while others stay in the periphery? This paper by Helsley and Zenou reveals that our geographic location is often a reflection of our "social centrality." By integrating graph theory with urban land-use models, the authors show that individuals who are more central in social networks—measured by their Katz–Bonacich centrality—gain more from interactions and are thus more willing to pay the high costs of living in a central hub.
Background Positioning
In the landscape of economic theory, this work serves as a vital bridge. It moves beyond the "black box" of urban spillovers found in classical models (like those of Marshall or Jacobs) and provides a rigorous mathematical foundation for how specific social architectures (star vs. complete networks) influence urban density and labor market outcomes.
Problem & Motivation: The Missing Link in Urban Sprawl
Urban economics has long known that proximity facilitates interaction. However, previous models assumed interaction was a passive byproduct of location. Helsley and Zenou argue the opposite: interaction is a choice.
The friction lies in the "dual distance" agents face:
- Physical Distance: The cost of commuting to the center.
- Social Distance: The value derived from one’s network links.
Current models failed to explain the feedback loop where a "good" social position makes a "central" physical position more valuable, and vice-versa.
Methodology: Centrality as a Driver of Effort
The core of the paper rests on the Katz–Bonacich Centrality. Unlike simple degree centrality (counting links), this measure accounts for the "prestige" of your contacts and the paths that emanate from them across the entire network.
The authors propose a utility function where an individual's benefit from interacting increases if their network neighbors also put in high effort (Strategic Complementarity).
Model Architecture
The model follows a two-stage game:
- Stage 1: Location Choice: Agents choose the Center (high cost , zero commute) or Periphery (low cost, high commute ).
- Stage 2: Effort Decision: Agents choose how many visits () to make to the interaction center.
 Note: The figure illustrates a Star Network, a key structure used to demonstrate how "Core" agents (1) behave differently than "Peripheral" agents (2, 3).
The math reveals a beautiful intuition: Your optimal interaction effort is exactly equal to your weighted Katz–Bonacich centrality. If you are well-connected, you work harder at being social because the payoff is higher.
Experiments & Results: The Rise of the Core-Periphery City
The paper characterizes the "Subgame-Perfect Nash Equilibrium" across different network types:
- Star Networks: Produce a "Core-Periphery" equilibrium where only the "star" agent lives in the center.
- Regular/Complete Networks: Tend toward extreme outcomes—either everyone clusters in the center or everyone stays in the periphery—because everyone’s social value is identical.
- Density & Aggregate Activity: Denser networks (more links) lead to higher aggregate efforts.
The Labor Market Impact
One of the most striking applications is to the Spatial Mismatch Hypothesis. The authors suggest that the high unemployment of minority groups (often living in inner-city peripheries far from jobs) isn't just about distance to jobs. It's about Social Mismatch. Because these groups may be less central in "old-boy" networks, their incentive to live near job-info hubs is lower, leading to a self-reinforcing cycle of isolation.
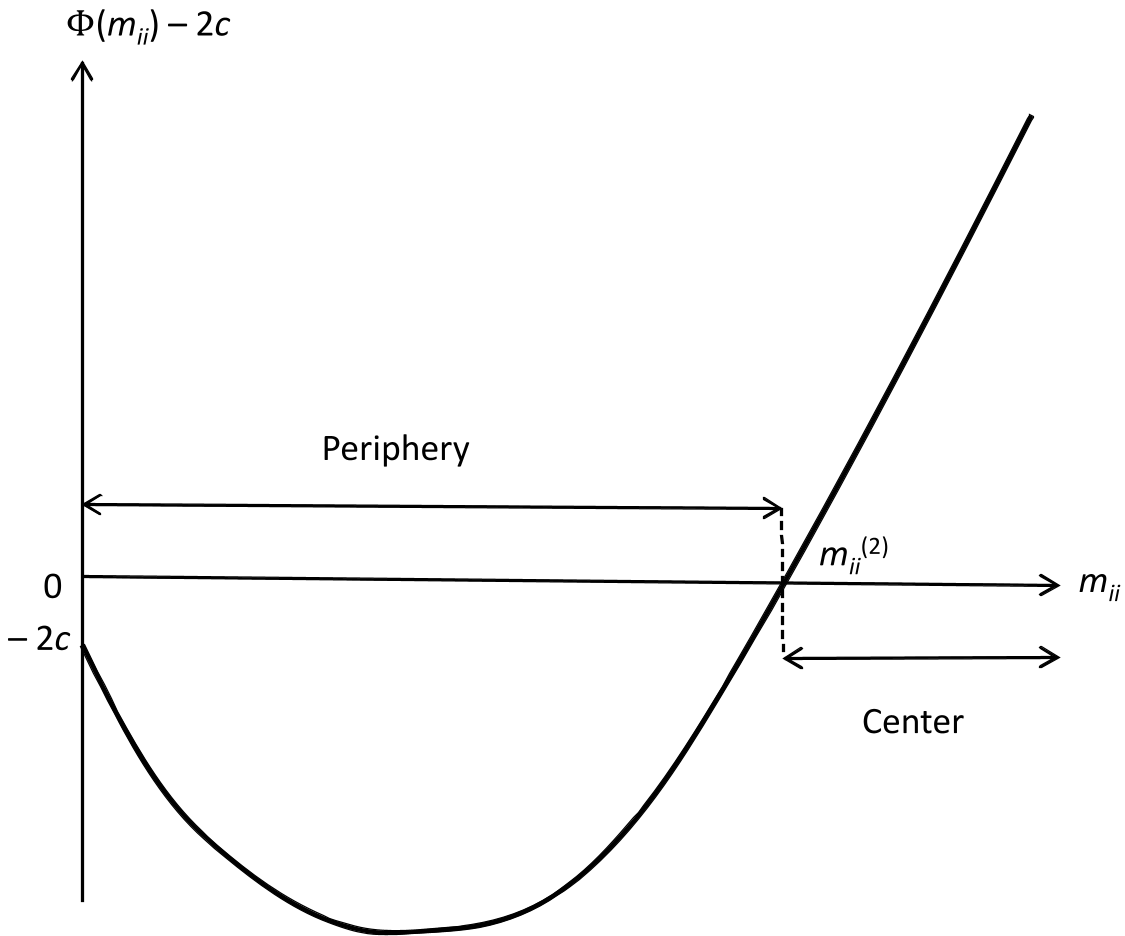 This visualization characterizes how self-loop paths () determine the geographic threshold for moving to the center.
Critical Analysis & Conclusion
Takeaway
The paper proves that geographic segregation is often a downstream effect of social networks. To fix a city's economic health, you can't just build faster trains; you have to build stronger social bridges.
Limitations
- Static Networks: The model assumes the social network is inherited or exogenous. In reality, people often choose their location to change their network.
- Single Interaction Center: Modern "polycentric" cities have multiple hubs (e.g., suburban tech campuses), which adds a layer of complexity not captured here.
Future Outlook
As digital interactions (Zoom, Slack) reduce the "decay factor" of distance, will the geographic clustering of central network figures decrease, or will "face-to-face" interactions remain the ultimate high-value currency that keeps the city center alive? This model provides the foundation to answer that very 21st-century question.