
Decoding the Pulse of Twitter: A Social Sensor Approach to Network Dynamics
Social sensor analytics: Making sense of network models in social media
The paper presents a "Social Sensor" framework for analyzing information diffusion on Twitter, integrating time-series event detection with dynamic graph spectra analysis. Leveraging hashtag similarity for topic modeling and a modified CUSUM algorithm for aberration detection, it categorizes events into distinct profiles to inform influence models like PhySense.
TL;DR
Social media is more than just a communication tool; it is a global sensor network. This paper revisits how we define "social signals" by combining time-series analysis (to find when things happen) with dynamic graph spectra (to see how the network reacts). By filtering out the noise of daily "chatter" and focusing on structural evolution, the authors provide a prerequisite framework for validating complex network influence models like PhySense.
Background: Positioning Twitter as a Noisy Sensor
In the academic landscape of social media analytics, researchers generally fall into two camps: those who look at Time Series (frequency of keywords) and those who look at Graphs (who follows whom). This work occupies the intersection, treating each user as a "sensor" that filters real-world information into a digital medium.
The core challenge addressed is Non-stationarity. Social media data isn't stable; it has daily peaks, weekly cycles, and sudden drifts in interest. Traditional detection methods often fail because they assume a constant mean and variance, treating a natural surge in activity as a "false alarm."
Methodology: The Core Engine
The researchers' pipeline involves three critical stages to turn raw tweets into actionable network insights.
1. Robust Event Detection via Localized CUSUM
Instead of a global threshold, the authors use a Cumulative Sum (CUSUM) method that adapts locally:
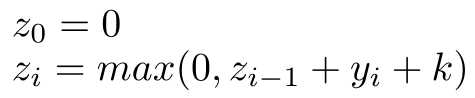
By normalizing the signal based on a sliding window, the model can detect aberrations even when the "background noise" of Twitter is trending up or down.
2. Band Threshold Filtering
To prevent periodic behavior (like the daily rise and fall of users waking up and going to sleep) from triggering event detections, they apply a Discrete Fourier Transform (DFT). This acts as a "de-noising" step, allowing the model to ignore the expected daily rhythm and focus on the unexpected bursts of information.
3. Spectral Signatures of Diffusion
This is the paper's most sophisticated insight. For every detected event (like a goal in the World Cup), the authors reconstruct the graph's evolution. They calculate the leading eigenvalues () of the graph Laplacian over time.
- The Intuition: As eigenvalues shift, they represent changes in the "algebraic connectivity" and centrality of the network. A "viral" event looks different in the spectral domain than a "localized" community discussion.
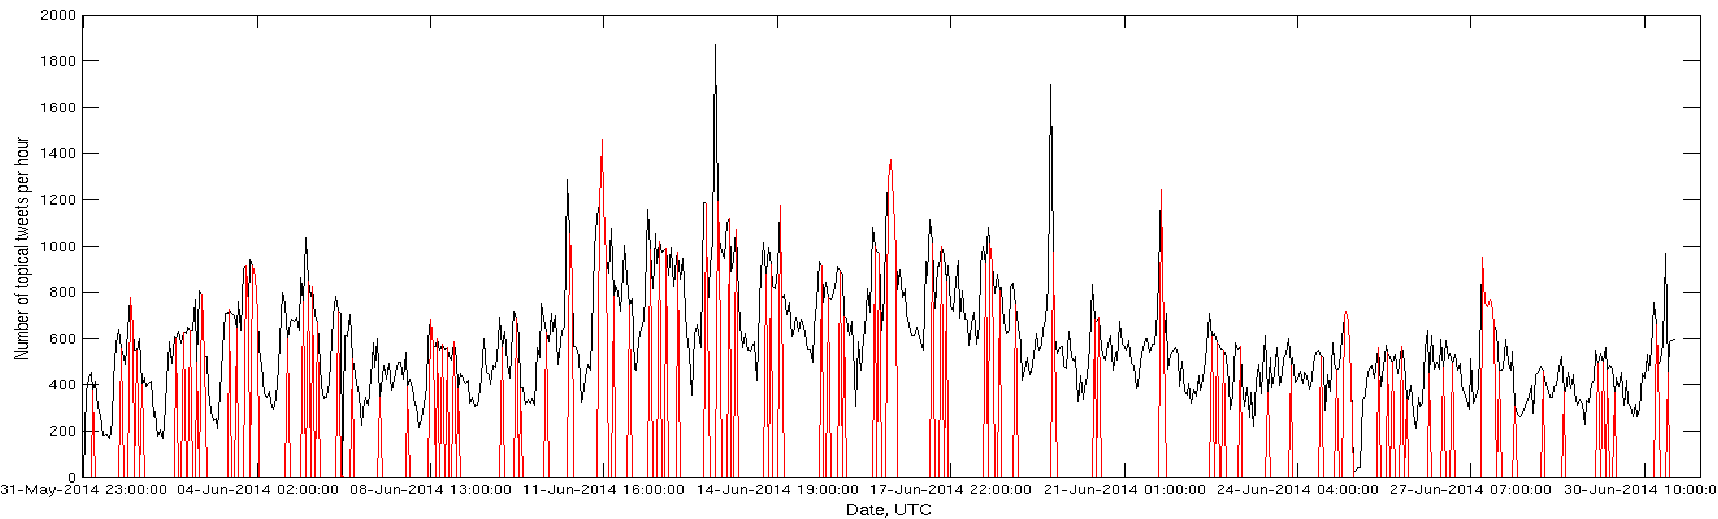 Fig 1: The structural evolution of an event shows how a sparse network rapidly coalesces into a dense connected component.
Experiments and Results
Using a massive dataset of 650 million tweets from June 2014, the authors applied their framework to the FIFA World Cup.
- Clustering Shapes: They identified 6 distinct "event profiles" (centroids) in the time series. This moves beyond simple volume counting to understanding the shape of human reaction—some events are explosive and short-lived, while others have a "bi-modal" sustain.
- Graph Growth: They observed a transition from almost empty networks to complex structures with 935+ edges within a single 24-hour cycle of a detected event.
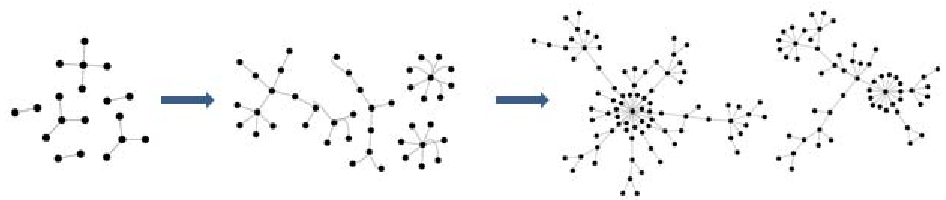 Fig 2: Categorization of event shapes allows for distinguishing between different types of social phenomena.
Critical Insight & Future Outlook
The true value of this work lies in its Evidence Generation. Most graph models are evaluated on static snapshots. By providing a trajectory of graph spectra, the authors give modelers a "ground truth" to aim for.
Limitations: The window sizes and sigma thresholds () currently require manual tuning. For a truly "autonomous" social sensor, these parameters must become self-adaptive.
The Takeaway: If we want to predict how information spreads, we cannot look at the graph alone or the time-series alone. We must look at the Spectral Signature—the way the network's mathematical "vibrations" change as news ripples through the population.