
Ariadne: Bridging the Gap Between Code Architecture and Team Coordination
Analyzing a socio-technical visualization tool using usability inspection methods
This paper introduces Ariadne, a socio-technical visualization tool designed to map technical software dependencies to social relationships between developers. By synthesizing static-call graphs with configuration management data, it provides a node-and-edge sociogram aimed at improving coordination in large-scale software projects.
In the complex ecosystem of modern software engineering, the code isn't just a set of instructions—it is a map of human relationships. When a developer changes a core library, they aren't just modifying "code units"; they are inadvertently creating a task for every other developer who depends on that library. This is the core premise of Ariadne, a socio-technical visualization tool that aims to make these invisible human-to-human links visible.
TL;DR
Ariadne is a visualization tool that maps technical dependencies (who calls whose code) to social networks (who needs to talk to whom). Instead of jumping straight to expensive user testing, the researchers used a suite of Usability Inspection Methods—from Tufte’s design principles to Cognitive Walkthroughs—to refine the tool’s interface, proving that formal inspection can uncover deep design flaws in complex visualizations long before a single user sits down at the keyboard.
The Motivation: Conway’s Law in Action
The research is grounded in Conway's Law, which suggests that the technical structure of a system reflects the communication structure of the organization that built it. The problem? Most development environments only show you the code, not the people.
The authors identified a critical "socio-technical gap." When technical dependencies exist, communication is required. If that communication breaks down, the project enters a state of coordination failure. Ariadne targets this by creating a sociogram derived from matrix multiplication of static-call graphs and authorship data.
Methodology: Seeing Through the Matrix
Ariadne departs from traditional node-and-link social graphs by using a table-based layout. This decision was made to handle high-density data more effectively.
- X-axis: Code units (packages, classes, methods), ordered alphabetically.
- Y-axis: Authors/Developers.
- The Logic: Lines connect a dependent author to a code unit, then link back to the author responsible for that unit.
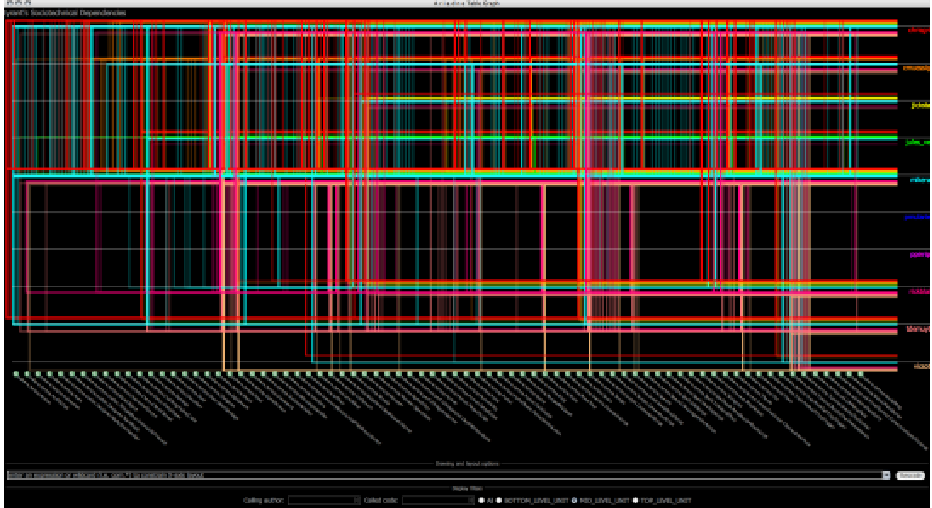 Figure 1: The visualization reveals how developer "Chrisgri" (red) influences multiple modules, highlighting their central role in the socio-technical network.
The Inspection "Gauntlet"
To evaluate the tool, the team didn't just ask "Does it look good?" They applied four rigorous academic frameworks:
- Tufte’s General Principles: Investigating the data-to-ink ratio and visual integrity.
- Heuristic Evaluation: Checking against established UI "rules of thumb."
- Cognitive Walkthrough: Simulating a new user’s mental process to see if the goals align with the system's actions.
- Cognitive Dimensions of Notations: Analyzing the "hidden dependencies" and "viscosity" (resistance to change) within the visualization itself.
Insights and Results: Beyond Simple "Bugs"
The inspection methods revealed that while the underlying data was sound, the representation had significant friction points:
- Color Overload: The Cognitive Walkthrough and Tufte analysis found that tracking many colors across a dense graph was mentally taxing.
- The "Undo" Problem: Heuristic Evaluation highlighted a lack of navigation history. In an exploratory tool, being unable to "trace back" filtering actions is a major usability blocker.
- Feedback Loops: The system failed to communicate when a dependency didn't exist or when a refresh was in progress, leading to user uncertainty.
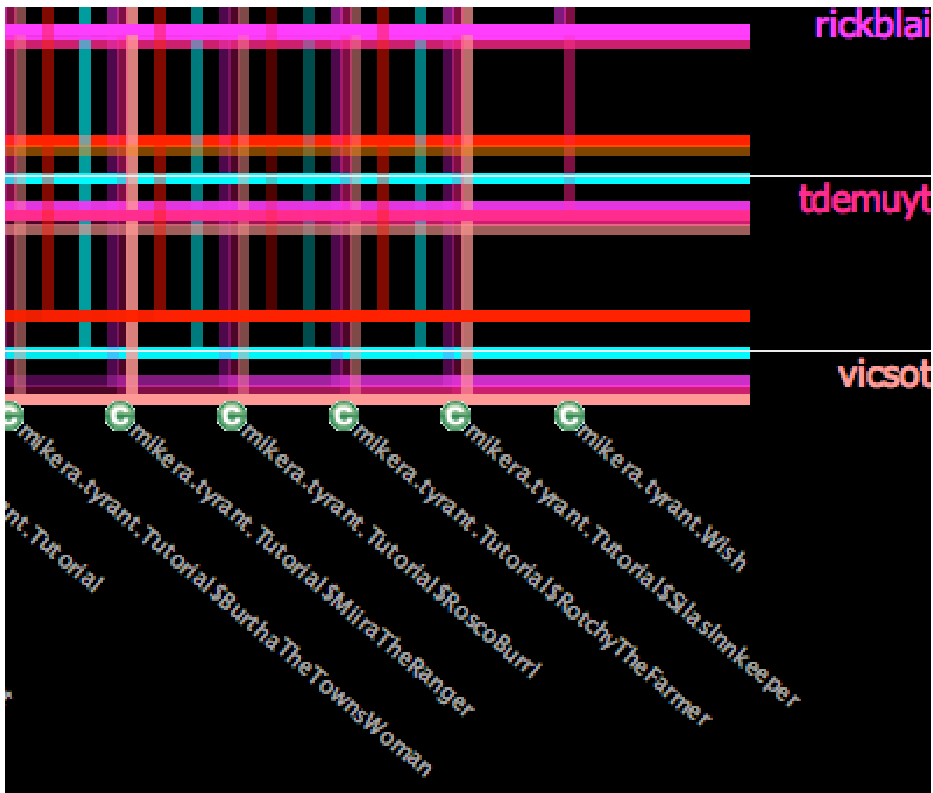 Figure 2: Close-up of dependencies in Java project 'Tyrant,' showing the intricate web of cross-package calls.
Critical Analysis & Conclusion
Ariadne proves that Usability Inspection is not just for menus and buttons; it's a powerful tool for complex information interfaces. By using these "experts-only" methods, the researchers gained a "rationale"—a deep understanding of why certain visual choices work or fail—which is often missing from raw performance data gathered in human trials.
Limitations & Future Work
While Ariadne is powerful for static analysis, its current iteration lacks advanced features like zooming and historical "evolution" views. Future iterations will likely integrate Information Visualization (InfoVis) specific heuristics to handle larger data sets and more dynamic developer behaviors.
The Takeaway: In the era of distributed teams and massive microservice architectures, tools like Ariadne represent the future of "Continuous Coordination." For developers and managers, the lesson is clear: if you want to understand your code, you must first understand your people.