
Predictive Analytics in Agriculture: Decoding Soil and Climate Synergy for Bangladesh's Crop Yields
Analysis of Soil Properties and Climatic Data to Predict Crop Yields and Cluster Different Agricultural Regions of Bangladesh
This paper presents a comprehensive data mining framework to predict yields for four major crops in Bangladesh (Wheat, Jute, T-Aman, and Mustard) by analyzing soil properties and climatic data across 28 sub-districts. The study employs a hybrid approach using clustering algorithms like PAM and K-means to categorize agricultural regions and regression models, specifically the Generalized Linear Model (GLM), to achieve high-precision yield forecasting.
TL;DR
Agriculture remains the backbone of Bangladesh’s economy, contributing 16% to its GDP. This paper leverages data mining to move beyond "informed guessing" in farming. By clustering 28 sub-districts based on soil nutrients and climate, and applying advanced regression, the study identifies the Generalized Linear Model (GLM) and PAM clustering as the gold standards for predicting the yields of Wheat, Jute, T-Aman, and Mustard.
Problem & Motivation: The Complexity of the Earth
Predicting crop yield is not as simple as measuring rainfall. It is a high-dimensional puzzle involving soil pH, organic matter, and a cocktail of minerals (Nitrogen, Phosphorus, Potassium, etc.), alongside atmospheric variables like humidity and temperature.
The authors identified that while data exists, it is often fragmented. The motivation was to create a unified statistical framework that can tell a farmer in a specific sub-district exactly which variables (e.g., Sulphur levels or average Temperature) are the bottlenecks for their specific crop.
Methodology - The Hybrid Approach
The researchers didn't just pick one algorithm; they staged a "battle of the models" across two primary land types: Medium Highland and Highland.
1. Spatial Clustering (The "Where")
To group similar regions, the study tested:
- K-means: Ideal for intra-cluster variance minimization.
- PAM (Partitioning Around Medoids): More robust to outliers than K-means.
- DBSCAN: Used to find density-based patterns and identify outliers in production data.
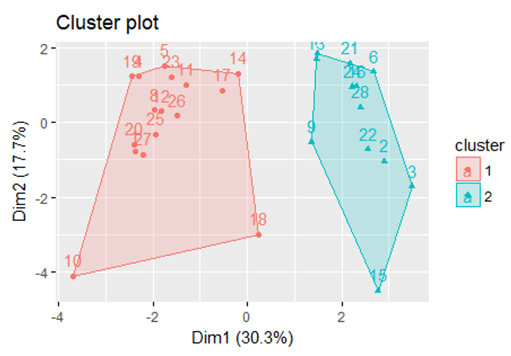 Fig 1: Identifying "unusual" agricultural zones (outliers) using DBSCAN clustering for Jute production.
2. Regression Modeling (The "How Much")
The study compared four linear approaches. The Stepwise Linear Regression (SWLR) was particularly interesting as it used the Akaike Information Criterion (AIC) to prune unimportant variables, ensuring the model doesn't overfit on "noise" minerals.
Experiments & Results: The Winner Emerges
The evaluation focused on two metrics: Internal Validation for clusters (Dunn Index) and RMSE for regression.
Clustering Performance
PAM proved to be the most reliable for agricultural zoning.
- PAM Precision: 0.961
- CLARA Precision: 0.606 The massive gap between PAM and CLARA suggests that while CLARA is designed for "large applications," the specific density and outlier distribution of agricultural data in Bangladesh favor the medoid-based approach of PAM.
Regression Accuracy
In the battle of prediction, the Generalized Linear Model (GLM) reigned supreme.
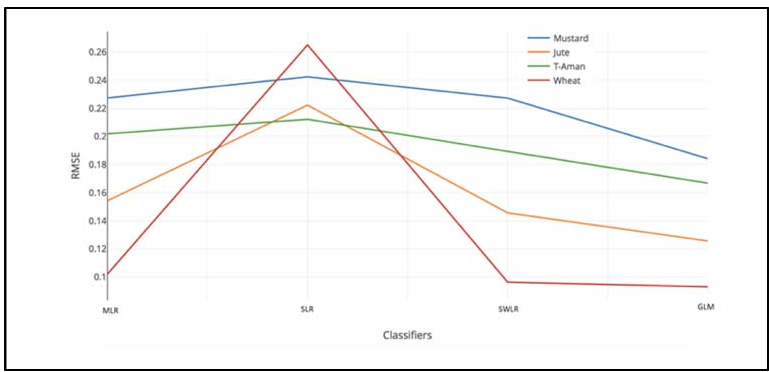 Fig 2: RMSE comparison shows GLM (right-most) consistently delivering the lowest error rates across both land types.
Key insights from the coefficients:
- Jute: Heavily influenced by Temperature and Phosphorus.
- Mustard: Highly sensitive to pH levels and Organic matter.
- T-Aman: Production is significantly tied to Rainfall and Manganese levels.
Critical Analysis & Conclusion
Takeaway
The study successfully transitions agricultural planning from traditional wisdom to statistical evidence. The discovery that GLM handles the continuous, non-strictly-linear nature of crop data better than standard OLS (Ordinary Least Squares) regression is a vital takeaway for regional agronomists.
Limitations
- Data Latency: The study relies on 6-year averages. Agriculture is increasingly affected by "flash" weather events (cyclones, heatwaves) which averages might smooth out.
- Factor Scope: The model does not yet account for fertilizer input types, pesticide use, or seed variety, which are major confounding variables.
Future Work
The authors suggest expanding the model to include soil moisture and water levels. For the next generation of this research, incorporating Satellite Imagery (Remote Sensing Data) could provide the real-time feedback loop needed to turn these static models into dynamic decision-support systems for farmers.