
Urban Soundscapes: Beyond Decibels with Context-Aware Crowdsourcing
Sound collection systems using a crowdsourcing approach to construct sound map based on subjective evaluation
This paper introduces a crowdsourcing-facilitated sound collection and visualization system designed to construct urban sound maps through both participatory and opportunistic sensing. Utilizing an Android-based platform, the researchers successfully gathered over 600,000 loudness samples and 5,900 subjective evaluations to analyze area characteristics, such as the impact of a new shopping mall on local urban acoustics.
TL;DR
Researchers from Okayama University have developed a comprehensive sound-mapping system that leverages the sensors in our pockets. By combining automated loudness tracking with user-provided "subjective labels" (such as how crowded a place feels), they’ve created a way to visualize not just how loud a city is, but why it sounds that way and how it impacts residents.
Background: The Limits of "Silent" Data
Smart city initiatives often treat sound as a purely physical metric—just a number on a decibel meter. However, a 70dB sound from a bustling cafe is perceived differently than 70dB from a construction site. Prior works like EarPhone and NoiseTube paved the way for mobile noise mapping, but they lacked the "Human-in-the-loop" context. The authors of this paper argue that to truly understand an urban environment, we must bridge the gap between physical acoustics and subjective human perception.
Methodology: Participatory vs. Opportunistic Sensing
The core of the system is an Android application that performs two distinct tasks simultaneously:
- Opportunistic Sensing: Without user intervention, the app records A-weighted loudness () every second, providing a continuous stream of statistical data.
- Participatory Sensing: Users can "tweet" 10-second audio clips when they find a location interesting. Crucially, they attach subjective scores for Loudness and Crowdedness (1-5 scales) and categorize the sound source (e.g., birds, traffic, music).
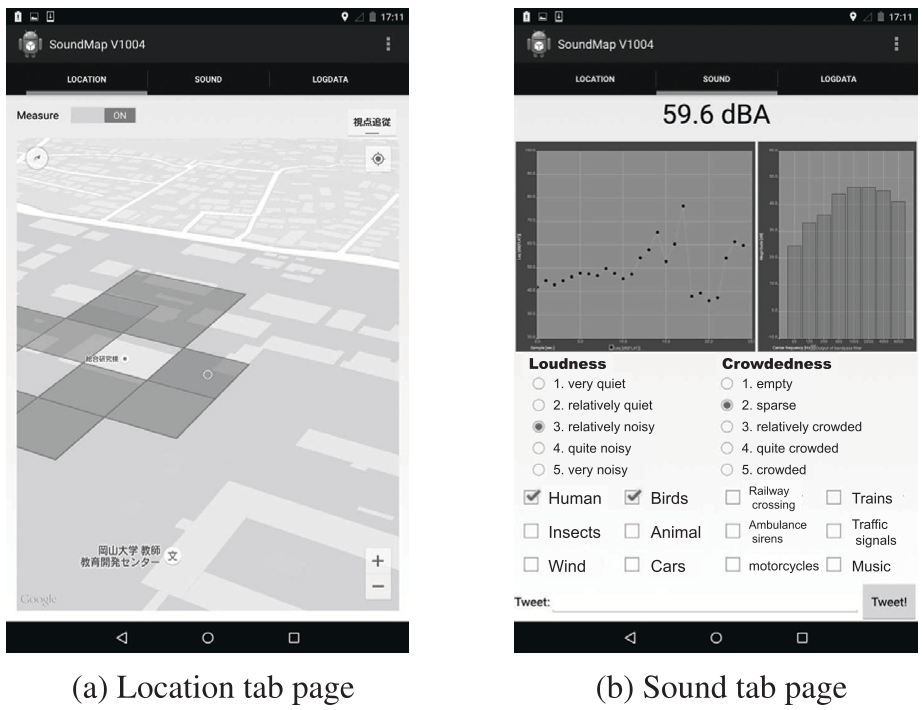 Fig 1: The Android interface for location logging and real-time sound annotation.
To solve the problem of hardware variance, the team measured and calibrated 22 different smartphone models against a professional RION NL–42 sound level meter, ensuring the crowdsourced data was scientifically valid.
Insights from the Data
The "Mall Effect"
One of the study's most compelling findings was the impact of a new large-scale shopping mall. By analyzing time-series data from before and after its opening, the researchers observed a distinct drop in loudness levels in traditional shopping districts. This "acoustic footprint" serves as a proxy for foot traffic, suggesting that sound levels can be used to monitor the economic health of different city sectors.
Correlation: Crowdedness vs. Loudness
The study discovered a fascinating asymmetry: it is much easier to estimate loudness if you know a place is "crowded," but a "loud" place isn't always crowded (e.g., wind or traffic noise in an empty street). This highlights why subjective context is vital for interpreting environmental data.
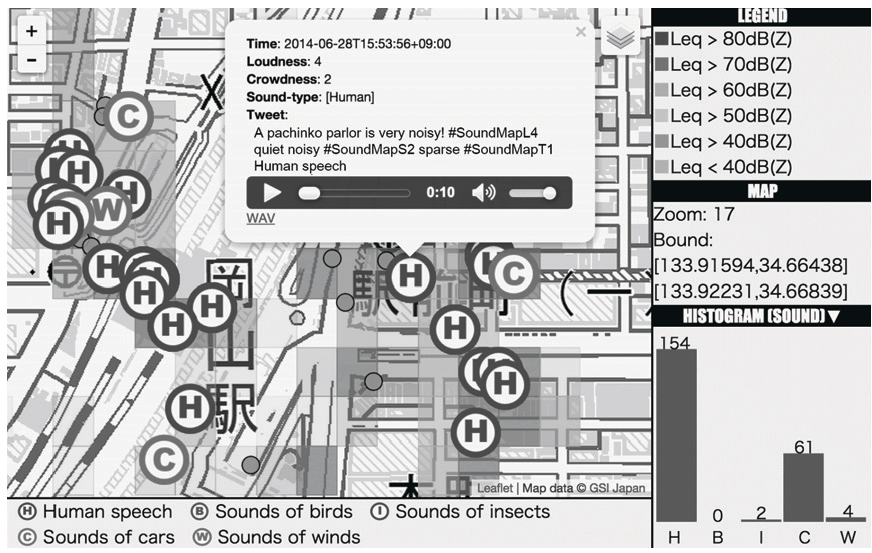 Fig 2: The final sound map uses icons to represent sound types and color-coded regions for statistical loudness.
Critical Analysis & Conclusion
Takeaway
This research shifts the focus from "monitoring noise pollution" to "understanding soundscapes." By using a scalable server architecture (MongoDB and Mojolicious), the system is ready for large-scale deployment.
Limitations & Future Work
The primary challenge remains calibration. While the authors calibrated 22 devices, there are thousands of Android variants. Future research should look into "blind calibration" techniques where a device calibrates itself by comparing its readings to nearby "trusted" sensors or other participants in the same location.
Ultimately, this work proves that the most powerful sensor in a smart city isn't a fixed pole on a street corner—it's the collective participation of the people living in it.