
Deciphering the City's Pulse: Beyond Noise Maps to Urban Soundscapes
Sound sensing using smartphones as a crowdsourcing approach
This paper presents a smartphone-based crowdsourcing system for urban sound sensing and visualization. By combining participatory and opportunistic sensing paradigms, the authors collected and mapped loudness levels (objective metrics) and sound-type annotations (subjective metrics) across two Japanese cities, Okayama and Kurashiki, to profile urban characteristics and monitor unusual events.
TL;DR
This research moves beyond simple "noise apps" by creating a crowdsourced sound-sensing framework that distinguishes between how loud a city is and what makes that noise. By deploying a custom Android application in Okayama and Kurashiki, the authors demonstrated that semantic sound mapping (identifying speech, cars, or nature) provides a much deeper understanding of urban dynamics and events than traditional decibel-only heatmaps.
Background: The Limits of Silence and Noise
In the context of Smart Cities, data is usually treated as a series of objective numbers. However, "loudness" is subjective. A crowded festival and a busy highway might share the same decibel level, but they offer vastly different social value. Previous works like EarPhone or NoiseTube succeeded in objective mapping (Noise Maps), while social media-based projects like Chatty Maps lacked real-time acoustic evidence.
The authors of this study address this gap by merging the two: objective loudness measurements combined with human-annotated sound types (Soundscapes).
Methodology: The Dual-Sensing Framework
The core of the system is a mobile application designed for two types of data collection:
- Opportunistic Sensing: The app runs in the background, calculating A-weighted loudness (Leq) every second. To protect privacy, raw audio is discarded after processing stats are saved.
- Participatory Sensing: When a user encounters an interesting acoustic environment, they can "Tweet" the sound. This records a 10-second WAV file and allows the user to tag it with categories like Human Speech (T1), Birds (T2), or Traffic Signals (T10).
Semantic Visualization
The researchers built a web platform using D3.js and Leaflet. The interface overlays two layers:
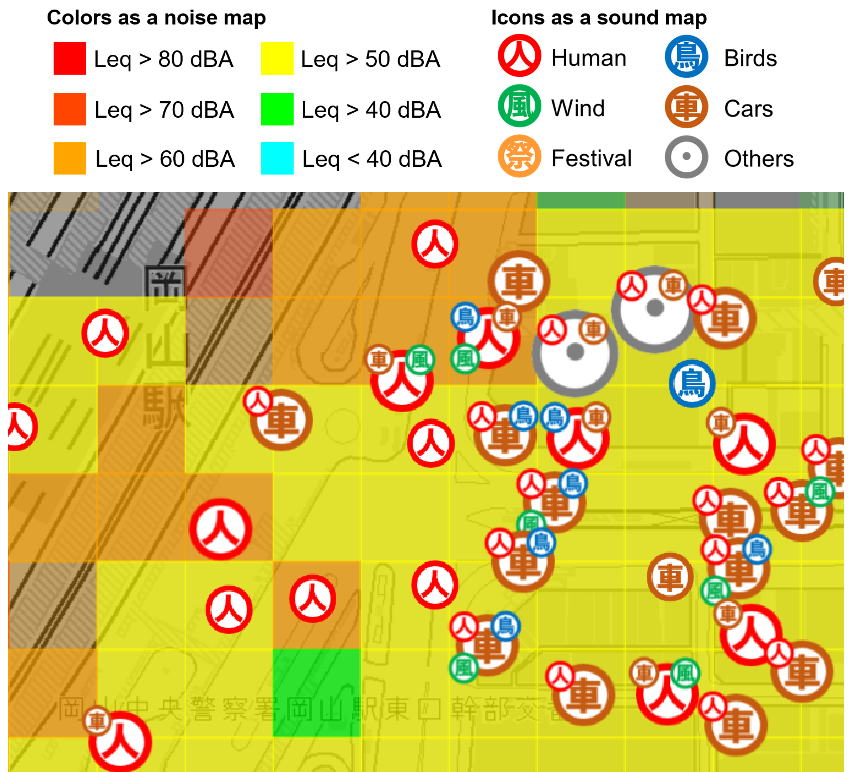
- Color Heatmap: Representing average loudness (Red for loud, Blue for quiet).
- Sound Icons: Clusters of icons identifying the dominant sound types in specific areas.
Experimental Analysis: Comparing City DNA
The system was deployed in two distinct environments. The results revealed the "acoustic personality" of each city:
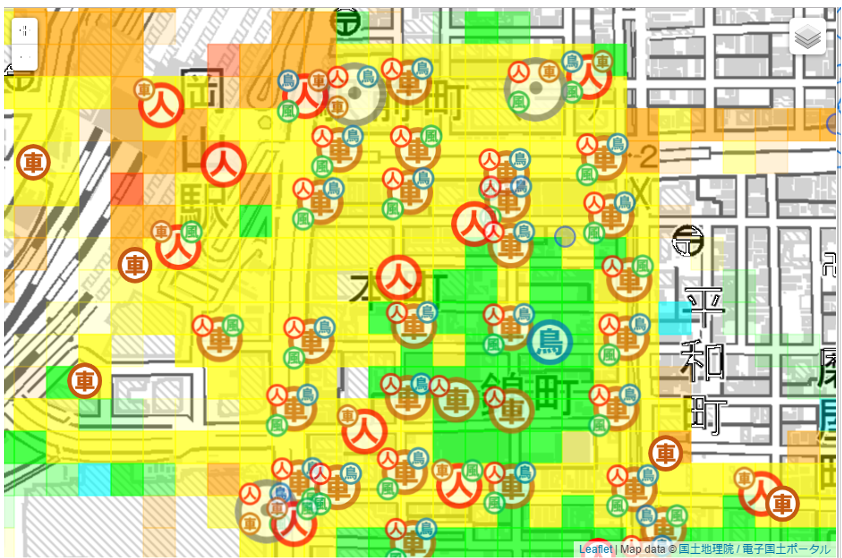
- Okayama (Business/Transport Hub): Showed high loudness levels dominated by T4 (Cars) and T11 (Music/Commercial noise).
- Kurashiki (Historical/Tourist District): While physically quieter in many areas, the sound map was peppered with T1 (Human speech) icons, identifying "bustling" areas that a pure noise map would have simply labeled as "loud."
Tracking Temporal Events (The Festival Study)
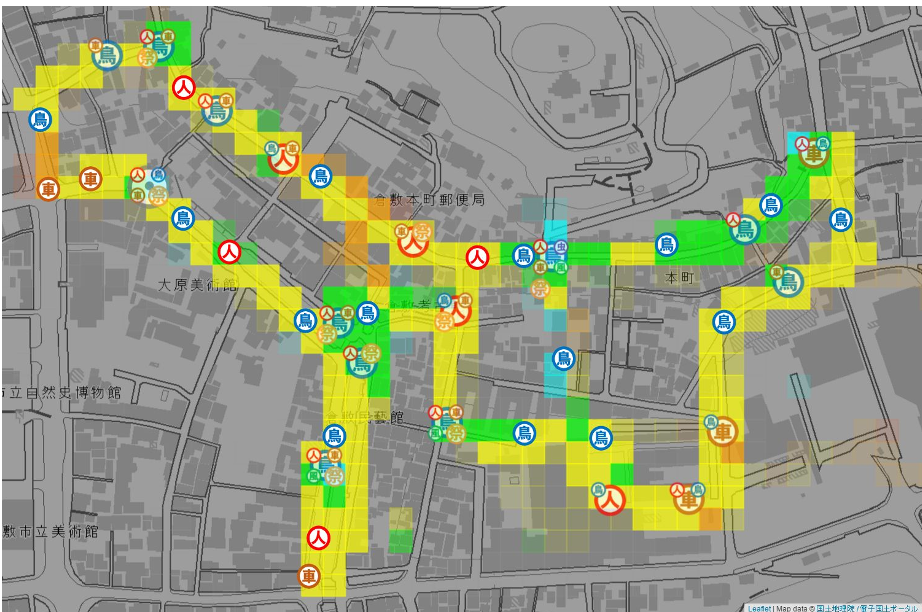
On October 16, 2016, the team monitored the Achi Shrine festival in Kurashiki. The sound map acted as a chronological diary of the event:
- 7 AM: Dominated by birds (quiet).
- 12 PM - 2 PM: Rapid shift to "Human Speech" and high-intensity noise spikes (red blocks) indicating specific festival performances.
Critical Insight & Conclusion
The study proves that crowdsourced sound sensing is a viable alternative to professional, expensive fixed-microphone arrays. The authors correctly identified that motivating users is the biggest hurdle; their survey results suggest that integrating sound sensing into "entertainment guides" or "festival apps" is the key to scaling the system.
Future Outlook: The next logical step is the automation of the "Participatory" phase. Currently, users must manually tag sounds. By applying modern Deep Learning (CNNs/Transformers) for Sound Event Detection (SED), future iterations could automatically identify sound types while maintaining privacy, truly scaling the "Soundscape" vision to a global level.
Takeaways
- Context Matters: A "loud" city isn't necessarily a "noisy" city.
- Inductive Bias: Using humans as "semantic filters" provides higher-quality urban metadata than raw signal processing alone.
- Privacy vs. Utility: Background processing of Leq is a robust compromise for long-term urban monitoring.