
Anatomizing the Pandemic: Reconstructing Spatial Invasion Pathways via IPI
Identifying Spatial Invasion of Pandemics on Metapopulation Networks Via Anatomizing Arrival History
The paper introduces the Invasion Pathways Identification (IPI) algorithm, a reverse-engineering framework designed to identify stochastic epidemic spread processes on metapopulation networks using arrival history data. By decomposing the spread into discrete "invasion cases" and applying maximum likelihood estimation (MLE), the method accurately reconstructs transmission pathways without requiring heavy parameter calibration or extensive simulations.
TL;DR
Predicting where a pandemic will go is hard, but figuring out how it got there—the actual invasion pathway—is often harder due to the stochastic nature of human mobility. This paper presents the Invasion Pathways Identification (IPI) algorithm, which reverses the arrival history of cases to map the most probable transmission routes across global metapopulation networks with unprecedented accuracy.
Background: The Limits of "Average" Models
In spatial epidemiology, we often look at "Effective Distance" or "Shortest Path Trees" (SPT) to guess how a virus like SARS-CoV-2 or H1N1 moves. While these models are great for general predictions, they suffer from a "mean-field" bias. Real pandemics don't move on averages; they move on single, often improbable, stochastic events. A single infected traveler on a low-traffic flight can trigger a massive outbreak, a scenario often smoothed out by traditional statistical models.
The Problem: The Hidden Causality of Infection
The core challenge is the reverse problem. Given that City B was infected at Time T, and its neighbors (Cities A, C, and D) were already infected, which city was the actual culprit?
- Heterogeneity: Traffic flows and population sizes vary wildly.
- Stochasticity: Disease arrival is a probabilistic event, not a deterministic one.
- Observability: We only see "arrival times," not the actual "traveler" who carried the pathogen.
Methodology: Anatomizing the Spread
The authors' insight is to break down the complex global network into local, manageable Invasion Cases (INC).
1. Partitioning the Invasion
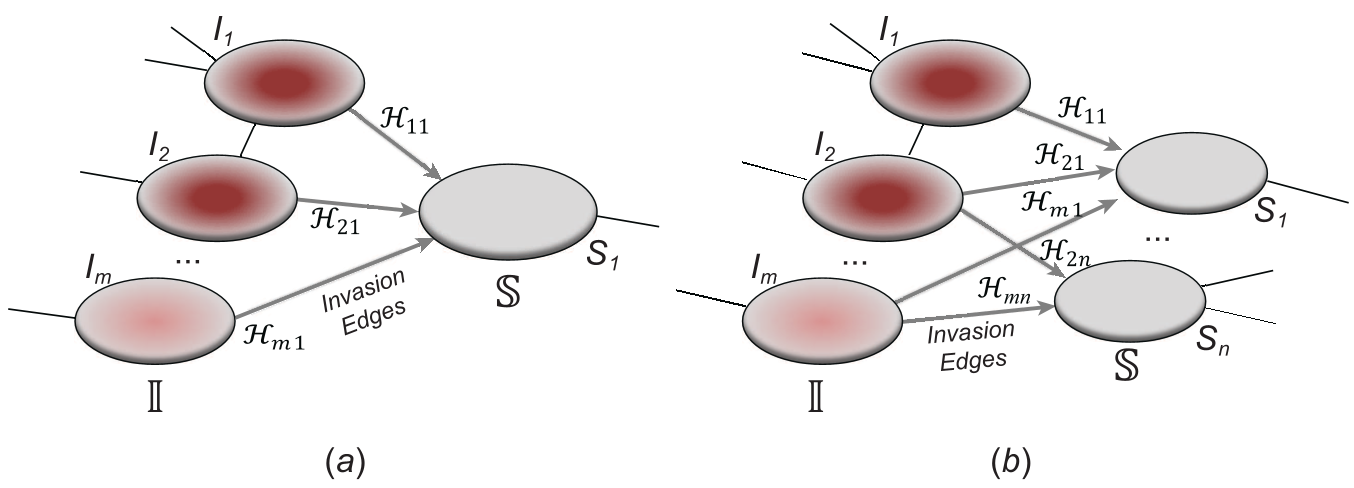
Instead of solving the whole network at once, the IPI algorithm decomposes the spread into four atomic scenarios:
- One-to-One (): Simple, direct invasion.
- One-to-Many (): A single hub infecting multiple neighbors.
- Many-to-One (): Multiple potential sources for a single infection.
- Many-to-Many (): The most complex, involving overlapping sources and targets.
2. The Transferring Estimator
To decide which source is most likely, the authors developed a Transferring Estimator. This is the mathematical heart of the paper. It uses the multinomial distribution of individual mobility to calculate the probability: The algorithm accounts for "Observable," "Partially Observable," and "Unobservable" subpopulations based on the variance of infected hosts during the invasion window. This allows the model to "peek" into the likelihood of travelers leaving one city for another.
3. Identifiability: A New Metric
How do we know if our identification is reliable? The authors introduce Identifiability (): Where is the maximum likelihood and is the Shannon entropy of the likelihood vector. If entropy is high, the "pathway" is inherently ambiguous (low identifiability).
Experimental Results: SOTA Comparison
The IPI algorithm was tested against three major baselines:
- ARR: Average-arrival-time-based shortest path tree.
- EFF: Effective-distance-based most probable paths.
- MCML: Monte-Carlo-Maximum-Likelihood tree.
Performance on American Airports Network (AAN)
On a real-world network of 404 US airports, IPI consistently achieved higher accuracy in identifying the "true" pathway used in the simulation. This was particularly evident in the early stages of the spread, where controlling the source is most critical.
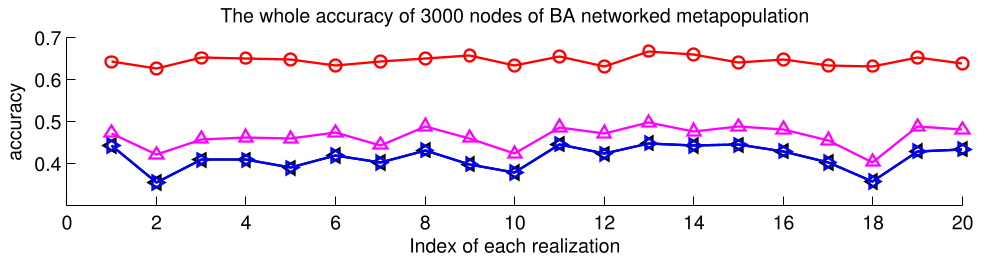
Scalability on BA Networks
In Large-scale Barabási-Albert (BA) networks (3000 nodes), the IPI algorithm maintained robust performance, proving it can handle global-scale data without the "curse of dimensionality" associated with full Monte Carlo simulations.
Critical Insight & Conclusion
The brilliance of the IPI algorithm lies in its efficiency. By treating the pandemic spread as a series of local optimization problems (dynamic programming), it avoids the need to simulate millions of "what-if" scenarios.
Takeaway: The study shifts the focus from "average" prediction to "specific" identification. For policy-makers, this means that instead of blanket travel bans, we can use arrival history to identify specific high-risk corridors that are actually driving the invasion.
Limitations: The model currently assumes a Susceptible-Infected (SI) dynamic. In the real world, recovery rates (SIR) and waning immunity (SIRS) add layers of complexity that might obscure the arrival signal.