
ScatterBlogs: Turning Twitter into a Real-Time Global Event Detector
Spatiotemporal anomaly detection through visual analysis of geolocated Twitter messages
The paper presents ScatterBlogs, a visual analytics system for spatiotemporal anomaly detection using geolocated Twitter streams. It introduces a scalable "Microblog Quantization" clustering algorithm and a "tag map" visualization to identify real-world events in real-time.
TL;DR
ScatterBlogs is a visual analytics workbench that treats millions of geolocated tweets as "semantic sensors." By employing a novel, scalable clustering algorithm called Microblog Quantization, the system automatically detects spatiotemporal anomalies—sudden spikes in specific terms at specific locations—allowing analysts to visualize crises, like earthquakes or riots, as they unfold in real-time.
Problem & Motivation: The Signal in the Noise
While Twitter is an invaluable source for "situational awareness," it is predominantly a "noisy" medium. During a crisis, there is a flood of "global chatter" (people hundreds of miles away talking about the news) that obscures the "local signals" from actual witnesses.
The researchers identified two primary technical hurdles:
- Scalability: How do you cluster millions of data points every day in real-time without the system crashing or slowing down?
- Precision: How do you separate a "global media reaction" from a "local physical event"?
Methodology: Microblog Quantization
The core engine of ScatterBlogs is an enhanced Lloyd clustering scheme optimized for streaming data.
1. Per-Term Streaming Analysis
Unlike traditional algorithms that look at a message as a whole, ScatterBlogs filters data on a per-term basis. For every unique word (e.g., "earthquake", "fire", "riot"), the system maintains a separate branch of clusters. This allows the system to detect specific topic-based anomalies without being distracted by unrelated background noise.
2. The Splitting & Aging Mechanism
To maintain performance, the system uses a best-effort relaxation step. Instead of re-clustering the entire history, it adapts clusters incrementally.
- Splitting: If a cluster's "distortion" (the spread of messages in time and space) exceeds a threshold , it splits into two.
- Significance: Clusters are weighted by a significance function that rewards high density and—crucially—unique user counts. If 100 tweets come from 1 user, it’s a bot; if they come from 100 users, it’s an event.
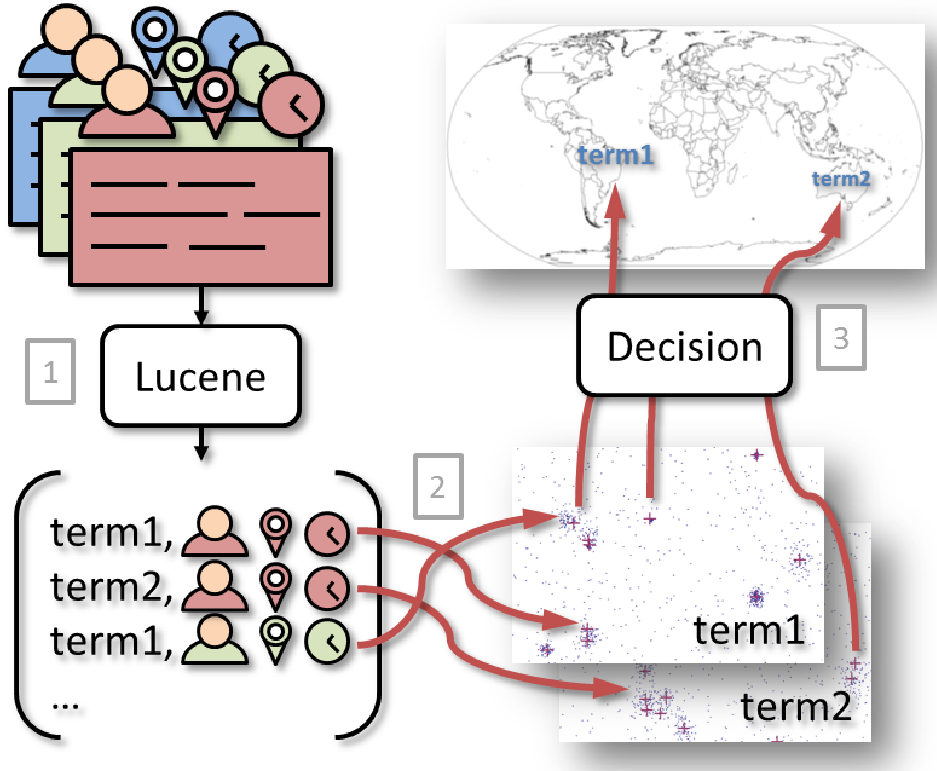 Figure 1: The three activities of the ScatterBlogs pipeline: extraction, quantization, and visualization.
Experiments & Results: Real-World Crisis Detection
The authors validated ScatterBlogs using several high-impact events from 2011:
The US East Coast Earthquake
By analyzing the first few minutes of the term "earthquake" on August 23, 2011, ScatterBlogs was able to visualize the shockwave's progression. The map showed a distinct "steep slope" in message frequency, typical of unforeseeable natural disasters. Analysts could use a "content lens" to verify that users were reporting tremors rather than just sharing news links.
The London Riots
For the London Riots, the system showcased its Semantic Zoom capability. In a zoomed-out view, "riot" appeared as a single large label. As the analyst zoomed in, the label split into specific hotspots like "Hackney" or "Peckham," allowing for hyper-local situational assessment.
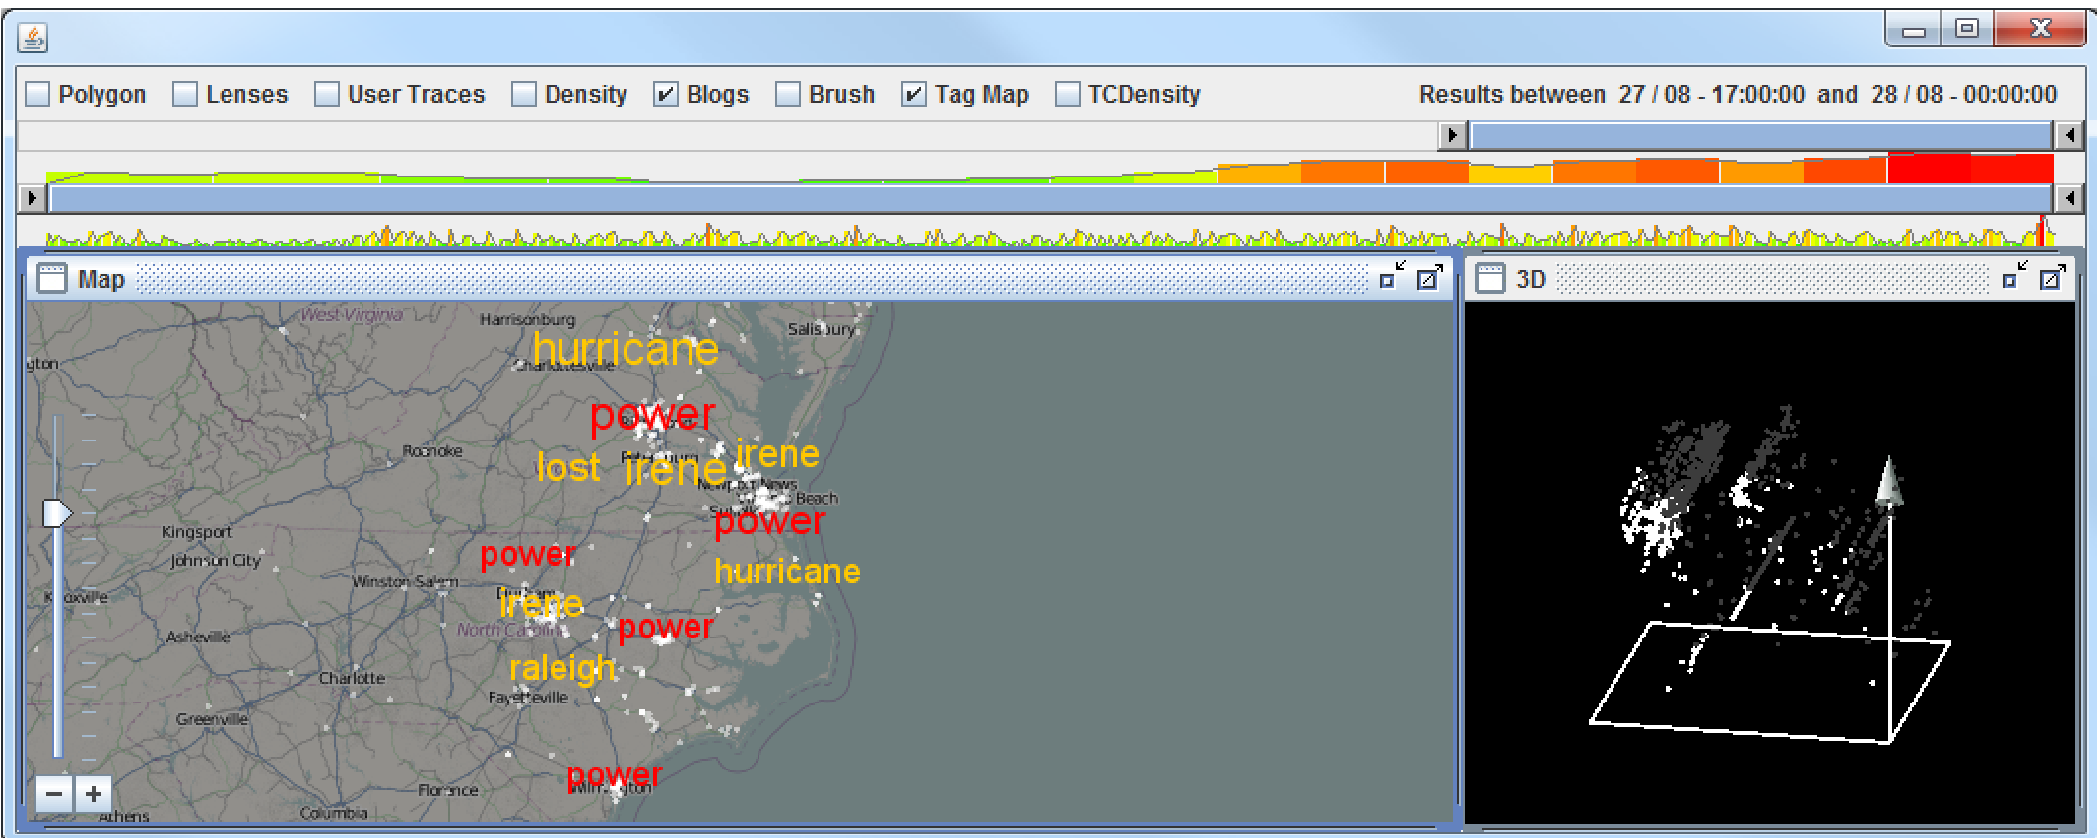 Figure 2: The ScatterBlogs workbench visualizing anomalies during Hurricane Irene. Prominent labels like "power" indicate localized infrastructure failures.
Performance Benchmarks
Operating on an Intel Core i7, the system proved it could handle the firehose:
- Processing Speed: 0.29ms per message.
- Throughput: Approximately 290 million messages per day—well above Twitter's actual geolocated volume.
Critical Analysis & Conclusion
The Takeaway
ScatterBlogs proves that social media isn't just a place for social interaction; it's a distributed sensor network. By focusing on the geospatial density of specific terms, researchers can cut through the noise of global media and find the people on the ground.
Limitations & Future Work
The current system relies heavily on keyword matching, which can be fooled by irony, metaphors, or different languages (the prototype focused on English). Furthermore, it treats "population density" and "tweet density" as synonymous, which can lead to false positives in highly active urban areas. Future iterations could benefit from Large Language Models (LLMs) to better understand the context of a "power anomaly" or "fire report" without relying on manual keyword lists.
Senior Editor's Note: This work remains a foundational example of how visual analytics can transform raw, unstructured Big Data into actionable intelligence for emergency responders.