
Deciphering the Pulse of the City: Regionalization of Social Interactions and POI Prediction
SPECIAL SECTION ON SOCIAL COMPUTING APPLICATIONS FOR SMART CITIES
This paper introduces a novel framework for urban regionalization using high-dimensional geosocial data from Twitter and Foursquare. It combines Geo-Self-Organizing Maps (GeoSOMs) with contiguity-constrained hierarchical clustering to identify homogeneous social interaction regions and employs Factorization Machines (FMs) to achieve superior Accuracy in Point-of-Interest (POI) location prediction.
TL;DR
Urban planners have long relied on rigid administrative boundaries to understand cities, but people don't live their lives according to postcode borders. This paper proposes a sophisticated machine learning pipeline that uses Twitter and Foursquare data to "re-map" cities into regions based on actual human behavior—demographics, topics of conversation, and timing. By using Geo-Self-Organizing Maps (GeoSOMs) and Factorization Machines, the authors proves that these "socially-defined" regions are far better at predicting where the next successful restaurant or hotel should be located.
Problem & Motivation: The Failure of Static Maps
Traditional urban data (censuses and surveys) is slow to collect and often aggregated into arbitrary units. This leads to two major issues:
- The Modifiable Areal Unit Problem (MAUP): Where results change purely based on how you draw the boundaries.
- Ecological Fallacy: Assuming individuals in a district match the average of that district.
The authors argue that social media offers a "high-dimensional trail" of human activity. However, most prior work only looks at one dimension (e.g., just location or just text). The challenge is: How do we fuse spatial, temporal, topical, and demographic data into a singular, cohesive understanding of urban regions?
Methodology: Fusing Multi-Dimensional Urban Data
The proposed framework operates in three distinct phases:
1. Data Enrichment and Modeling
The team didn't just use raw tweets. They enriched the data using:
- NLP (LDA): To extract latent topics (e.g., "Leisure/Outdoor" vs. "Work/Business").
- Demographic Inference: Using the SocialGlass platform to estimate age, gender, and residency status (Resident vs. Tourist).
- Foursquare Integration: Mapping tweets to 421 specific venue categories.
2. Neural Regionalization via GeoSOM
Standard clustering algorithms like K-means struggle with non-Gaussian spatial distributions. The authors chose Geo-Self-Organizing Maps (GeoSOM).
- Why GeoSOM? It allows for a "geographic tolerance" (k), ensuring that the neurons in the network represent locations that are close both in the physical world and in the high-dimensional attribute space.
 Table 1: The 9 variables used as input for the regionalization process.
After training the GeoSOM, they applied Ward’s hierarchical clustering to the neural weights to find the "optimal" number of regions, validated by a Silhouette Index.
3. POI Prediction with Factorization Machines
Once the regions were identified, they served as a key feature for a Factorization Machine (FM). FMs are particularly powerful here because geosocial data is highly sparse—most users haven't visited most places. FMs model the interaction between features (e.g., "Tourist" + "Nightlife Region" + "Restaurant Category") to predict the best administrative unit for a new POI.
Experiments & Results: Real-World Validation
The model was tested in three drastically different urban contexts: Amsterdam, Boston, and Jakarta.
Spatial Insights
In Amsterdam, the model clearly distinguished between "Nightlife" clusters (predominantly young tourists) and "Outdoors/Daytime" clusters (residents). In Jakarta, the complexity was much higher, requiring 42 distinct regions to capture the intricate social fabric.
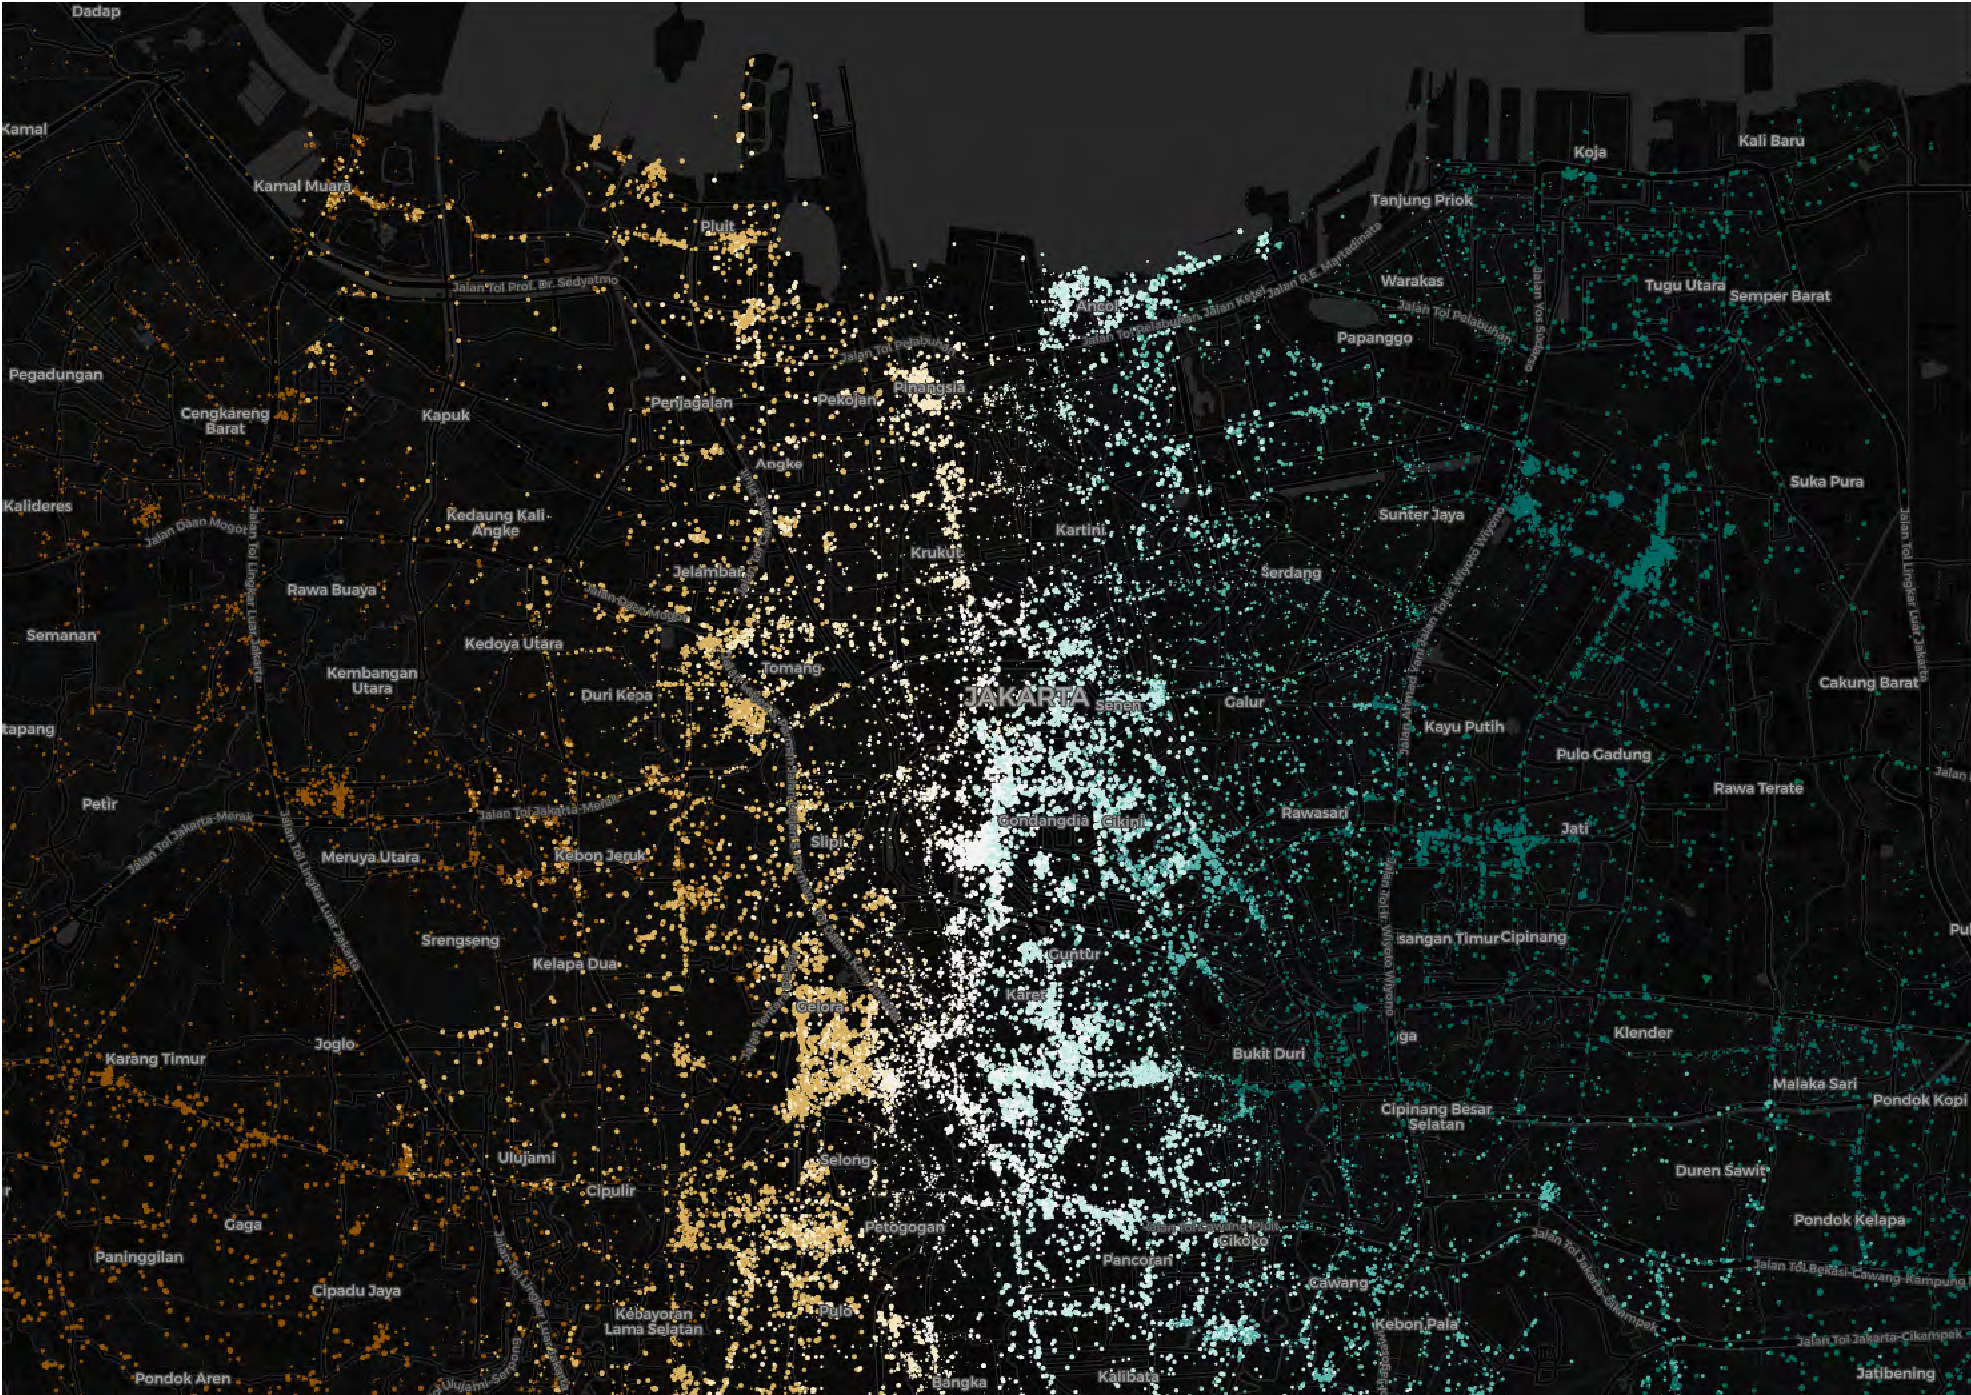 Figure 7: GeoSOM clusters illustrating age and social category distributions in Jakarta.
Predictive Performance
The Factorization Machine model achieved significant gains:
- FM vs. Baselines: FM consistently outperformed Logistic Regression and random classifiers across all cities.
- The "Region" Boost: Adding the "Social Region" as a feature improved the F-score(5) by 5.65%, proving that the latent social structure of a city is a powerful predictor of commercial viability.
| Feature Set | FM F-measure (Amsterdam) | FM F-score(5) (Amsterdam) |
|---|---|---|
| Category & Popularity | 0.0752 | 0.1045 |
| Cat + Pop + Social Region | 0.0794 | 0.1113 |
Note: While absolute values seem low, they are 8x higher than random chance in a multi-class (96+ units) classification task.
Critical Analysis & Conclusion
The Takeaway
The "character" of a city neighborhood is better defined by the interactions happening within it than by its historical boundary. By using machine learning to "uncover" these hidden neighborhoods, businesses can make more informed decisions about where to open new branches, and city planners can better understand the needs of mobile populations (tourists and commuters).
Limitations
- Demographic Bias: The study acknowledges that Twitter users skew younger and tech-savvier. The "social regions" reflect the behaviors of this subset, not necessarily senior citizens.
- Semantic Noise: LDA topics can sometimes conflate different activities due to the brevity and slang of tweets.
Future Work
The authors suggest incorporating morphological features—actually analyzing the physical street-level imagery—to see how the "look and feel" of a building interacts with the "social soul" of the data.
Senior Editor's Note: This paper is a masterclass in combining unsupervised neural learning (GeoSOM) with supervised predictive modeling (FM). It bridges the gap between traditional geography and modern data science.