
From Minutes to Seconds: Accelerating Social Network Analysis with CUDA
Speeding Up Network Layout and Centrality Measures for Social Computing Goals
This paper presents a strategy to accelerate graph layout (Fruchterman-Rheingold) and centrality metrics (Eigenvector) by leveraging the parallel architecture of NVIDIA GPUs via CUDA. Integrated into the NodeXL tool, the method achieves massive performance gains, including up to 804x speedup for layout and over 17,900x for centrality calculations.
TL;DR
Researchers have successfully ported heavy-duty Social Network Analysis (SNA) algorithms to NVIDIA's CUDA platform, achieving performance boosts of up to 17,000x. By integrating these GPU kernels into NodeXL, they've turned "overnight" computations into near-instantaneous visualizations, making large-scale graph analysis accessible on consumer-grade hardware.
The Scaling Wall in Social Computing
As social media—from Twitter to LinkedIn—continues to expand, the datasets available to analysts have grown exponentially. However, the algorithms used to make sense of these networks haven't naturally kept pace. Most social scientists and analysts use desktop-based tools like NodeXL, where complex algorithms like Fruchterman-Rheingold (for layout) and Eigenvector Centrality (for identifying influencers) are traditionally executed on the CPU.
The problem is simple math: Fruchterman-Rheingold layouts have a complexity of roughly . For a graph with 80,000 nodes, a standard CPU might take 30 minutes just to render a single layout. This "latency" kills the exploratory nature of data science.
The Insight: Parallelizing "Forces"
The authors realized that SNA algorithms fit perfectly into the GPGPU (General-Purpose computing on Graphics Processing Units) paradigm. They categorized SNA algorithms into three tiers of "Parallelization Difficulty":
- Easy Partitioning: Metrics like Eigenvector Centrality only require local neighbor data.
- Relatively Hard: Layouts like Fruchterman-Rheingold require global knowledge but can be approximated.
- Hard: Betweenness Centrality, which requires All-Pairs Shortest Paths.
1. Super Fruchterman-Rheingold
The core of force-directed layout involves calculating repulsive forces between every pair of nodes to prevent them from overlapping. Since the force on Node A doesn't depend on the current calculation for Node B, these millions of force calculations can be assigned to thousands of tiny GPU threads simultaneously.
(Note: Refer to the paper's framework integrating CUDA kernels into the NodeXL C# environment via a selectable layout option.)
2. Eigenvector Centrality & The Power Method
Finding the "most important" nodes involves calculating the principal eigenvector of the graph's adjacency matrix. The authors used the Power Method, which is essentially a series of matrix-vector multiplications. Since GPUs are specialized in linear algebra, this was a natural fit.
Breakthrough Results
The performance gains were not just incremental—they were transformative.
| Graph Instance | Nodes | Edges | CPU Time | GPU Time | Speedup |
|---|---|---|---|---|---|
| soc-Epinions1 | 75,879 | 508,837 | ~25 mins | 1.89 seconds | 804x |
| Oklahoma FB | 17,425 | 1.7M | ~2.7 hours | 0.55 seconds | 17,972x |
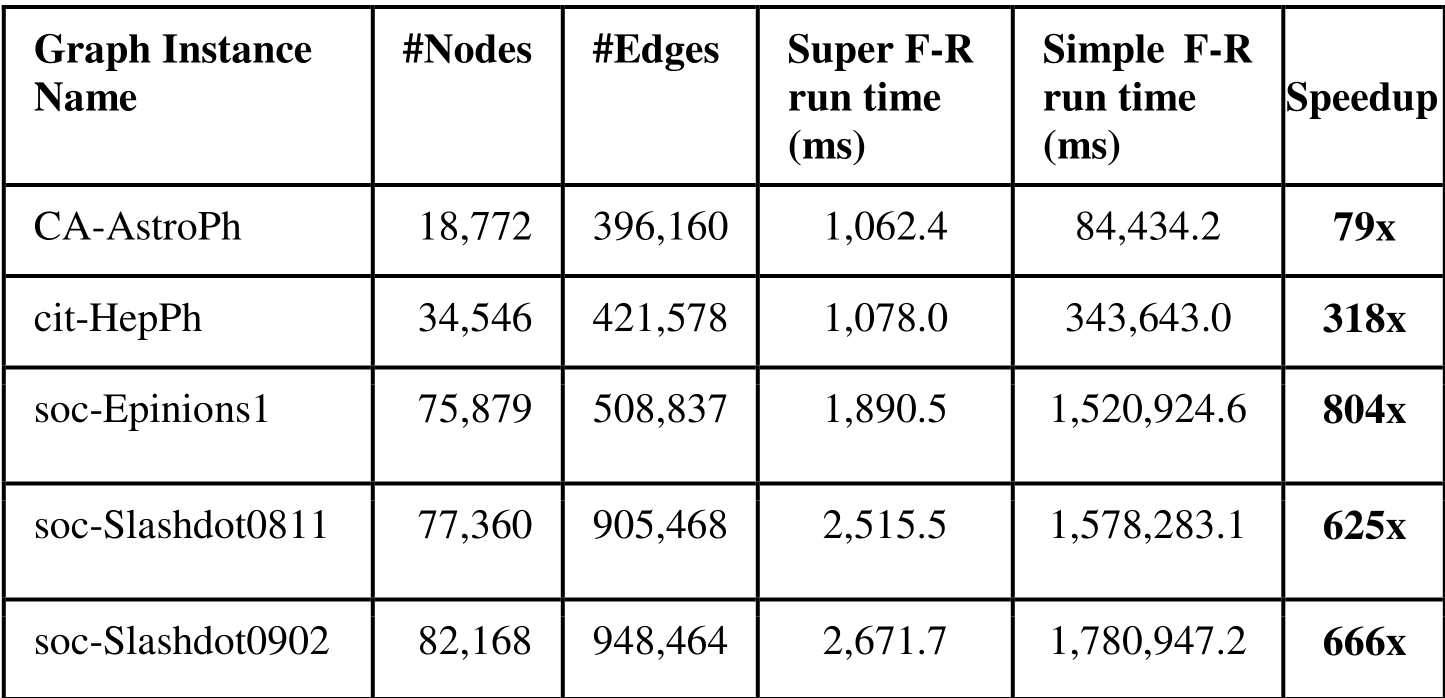 Table 1: Dramatic speedup in layout times across various SNAP datasets.
The data shows that speedup increases with graph size. This is because the overhead of moving data to the GPU is eventually outweighed by the massive parallel processing power once the workload is sufficiently large.
Critical Analysis & Looking Ahead
While the speedups are incredible, the authors identified a new bottleneck: The User Interface (UI). While the GPU can calculate the positions of 10 million nodes in seconds, Windows Presentation Foundation (WPF)—the tech used to draw the dots on the screen—crashes under the memory load.
Key Takeaways:
- Commodity Power: You don't need a supercomputer for SNA; a $300 GPU can outperform a CPU by four orders of magnitude.
- Bottleneck Shift: We have moved the problem from computation (math) to rendering (graphics pipelines).
- Future Work: The next frontier is parallelizing "Hard Partitioning" algorithms like Betweenness Centrality, which are far more complex to synchronize across GPU cores.
Conclusion
This work marks a milestone in making SNA "interactive." When an analyst can change a parameter and see a 100,000-node graph reorganize in two seconds rather than twenty minutes, it changes the way they ask questions of their data.