
SARS: Bridging the Gap Between Scientific Literature and Standardized Aerosol Data
A Standardized Aerosol Repository System for Knowledge Services and Crowdsourcing
The paper introduces SARS, a web-based Standardized Aerosol Repository System designed to centralize and digitize scattered aerosol data from diverse atmospheric research literatures. It combines automated image recognition with a crowdsourcing mechanism to build a comprehensive SOTA database for knowledge services like topic classification and data visualization.
TL;DR
Aerosol research is vital for understanding climate change, yet its data remains "trapped" in thousands of PDF documents and unstructured charts. The Standardized Aerosol Repository System (SARS) addresses this by utilizing image recognition algorithms to digitize plots and a crowdsourcing framework to maintain an ever-growing database of atmospheric parameters.
Background & Positioning
In the hierarchy of academic tools, SARS is a Knowledge Service Platform. It transitions the field from "Literature Search" (finding papers) to "Data Search" (finding specific values). By standardizing parameters like Lidar Ratio and Depolarization Ratio across different sensors and regions, it creates a unified coordinate system for global aerosol analysis.
The Pain Point: The "Dark Data" Problem
Atmospheric data is notoriously scattered. A researcher looking for aerosol trends in a specific province over 10 years might have to manually read 50 papers, screenshot their charts, and guess numerical values from pixel distances.
- Format Diversity: Data is hidden in scatter plots, histograms, and line graphs.
- Low Accessibility: Statistical "means" are in text, but raw "variations" are often only in images.
- Expertise Gap: Laypeople struggle to evaluate which papers provide high-authority data.
Methodology: From Pixels to Physical Parameters
SARS employs a multi-step pipeline to liberate data from PDF constraints.
1. Standardization Format Strategy (SFS)
Based on surveys with 30 experts, the authors identified 15 crucial attributes (Document, Text, and Image attributes) that define a high-quality aerosol record, ensuring that every entry in the database is queryable.
2. Automated Image Processing
Instead of manual transcription, the system uses computer vision:
- Scatter Plots: Employs the Hough Transform to detect circular or polygon data points.
- Histograms & Line Charts: Uses Canny Edge Detection to identify axes and trend lines.
- Coordinate Conversion: A mathematical mapping transforms image pixel coordinates into actual physical values based on axis limits.
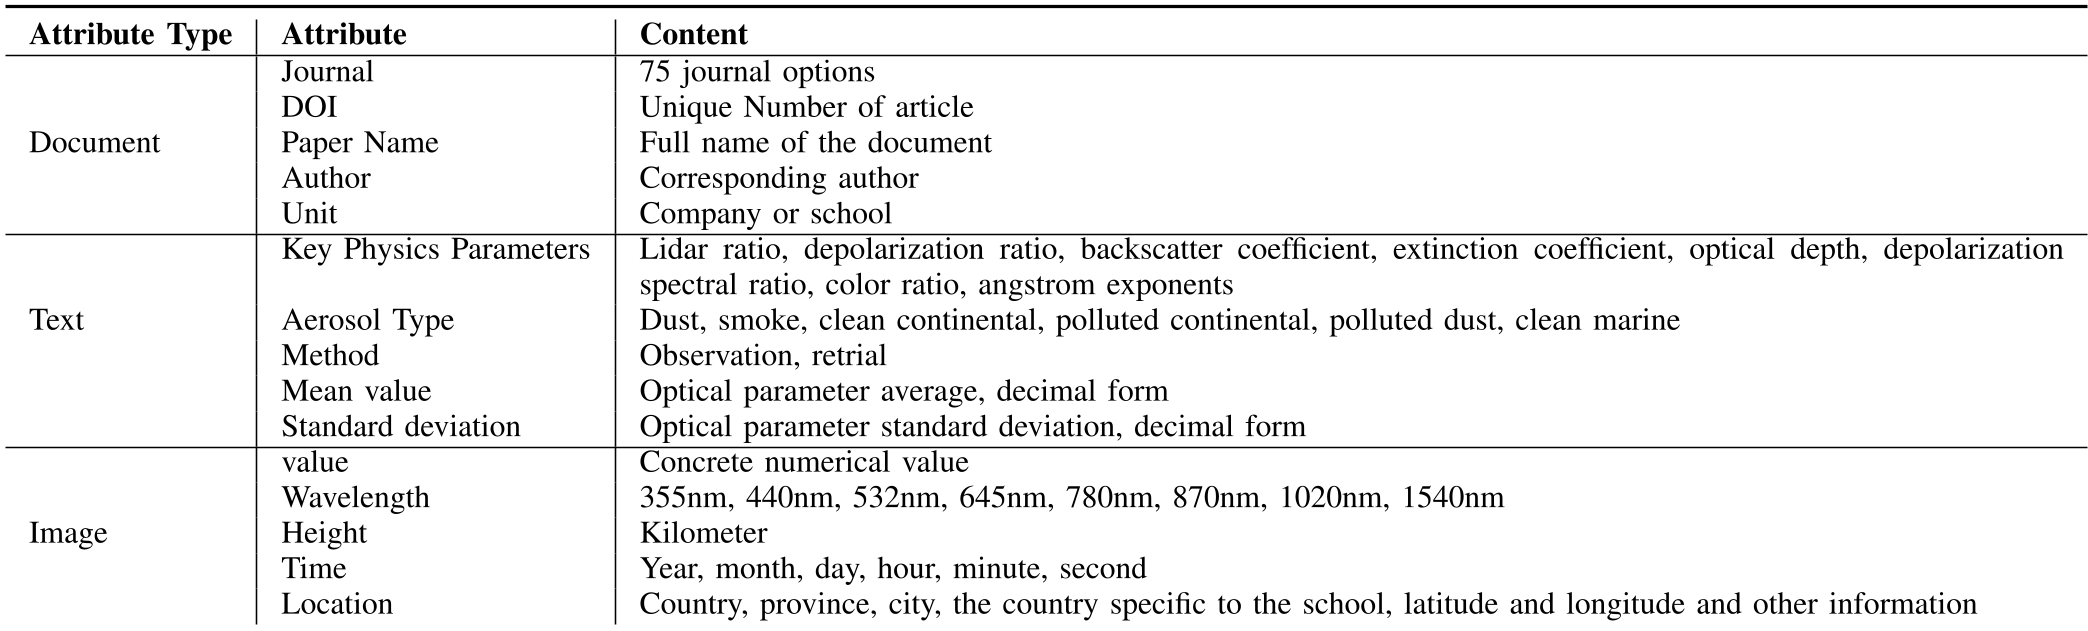 Table: The 15 data attributes standardized within the SARS repository.
Experiments & Results
The SARS database is already functional, covering over 10,000 papers.
- Geographic Coverage: Mapping data across continents, including detailed provincial data for China (e.g., Taiwan, Beijing, Xinjiang).
- Visualization Utility: The system can generate comparative plots. For instance, comparing 355nm and 532nm wavelengths allows researchers to identify aerosol species consistency.
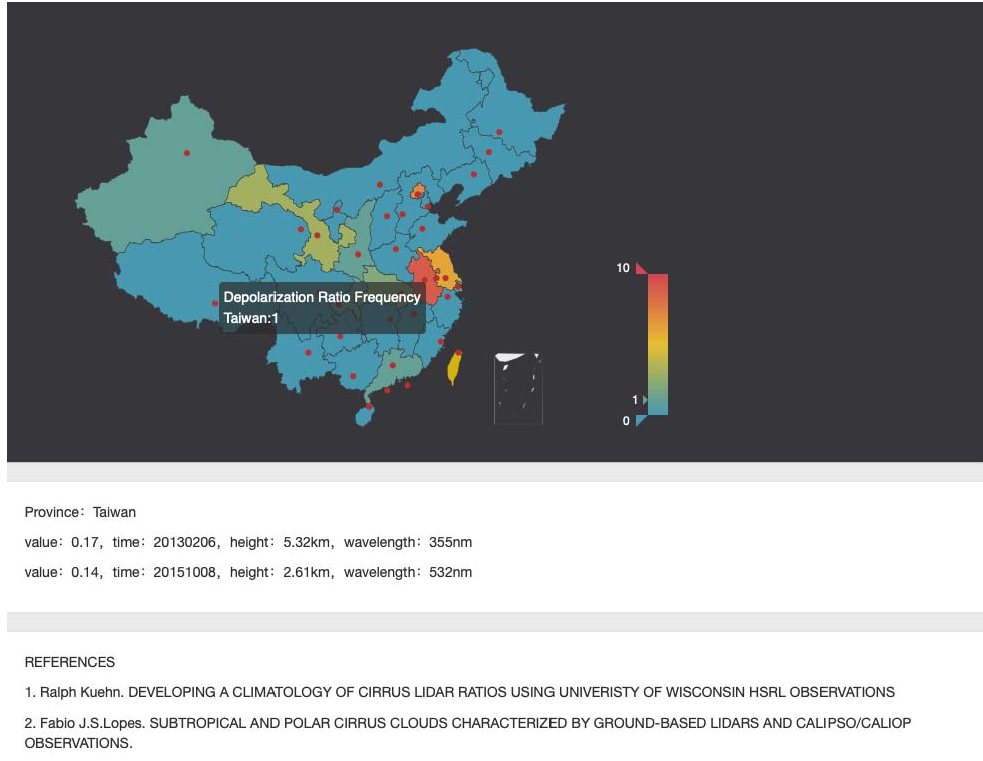 Figure: The visualization of Depolarization Ratio in Taiwan, illustrating the system's ability to localize data queries.
Crowdsourcing: The Engine of Extensibility
A repository is only as good as its latest update. SARS introduces a Crowdsourcing Submission module.
- Mechanism: Experts can upload their own formatted data or new images.
- Incentive: In exchange for data submission, users get access to "Paper Evaluation" and "Topic Classification" services, creating a self-sustaining ecosystem of data exchange.
Critical Insight & Conclusion
Takeaway
SARS proves that scientific "Review Papers" can be replaced by dynamic "Live Repositories." By digitizing the contents of figures—not just the metadata of the paper—the authors have unlocked a significant volume of empirical data for climate modeling.
Limitations & Future Work
While traditional CV (Hough/Canny) works for simple charts, complex thermodynamic diagrams and overlapping lines still require manual correction. The authors look toward Natural Language Processing (NLP) and more advanced Machine Learning to achieve 100% automation in the future.
This system represents a significant step toward "Open Science," where data is no longer hidden in text, but available for the entire research community to visualize and verify.