
Unmasking the Ghost Fleet: Using Social Network Analysis to Combat Global Illegal Fishing
Static and Dynamic Social Network Models for the Analysis of Transshipment in Illegal Fishing
The paper introduces a social network analysis (SNA) framework to investigate illegal, unreported, and unregulated (IUU) fishing by modeling maritime transshipment encounters as a graph. It utilizes a static analysis to identify key criminal enablers through a new "criminal centrality" metric and features a dynamic 3D visualization tool constructed from six years of Global Fishing Watch (GFW) AIS data to track the evolution and topology of illicit networks.
TL;DR
Illegal fishing is a $23.5 billion criminal industry protected by "transshipment"—the mid-ocean handoff of goods that masks their origin. This paper moves beyond tracking single ships to analyzing the social networks of the sea. By defining a new "Criminal Centrality" metric and using dynamic 3D visualizations of 6 years of AIS data, the authors reveal that illegal fishing networks are "emergent" and opportunistic, providing a roadmap for global enforcement.
Background: The Laundering of the Oceans
Illegal, unreported, and unregulated (IUU) fishing doesn't just steal food; it destroys ecosystems. The primary enabler is transshipment, where a fishing vessel offloads its catch to a refrigerated cargo ship (a "reefer"). Once the fish is on the reefer, it is mixed with legal catches, effectively laundering the product.
Previous research has focused on local monitoring, which causes a "displacement effect": criminals simply sail to a different country's waters. To solve this, the authors propose a global approach using the Automatic Identification System (AIS) data, treated as a social network.
Methodology: Mapping Maritime "Friendships"
The study transforms 12,000 transshipment encounters into a graph where:
- Nodes: Vessels (Fishing or Transshipment).
- Edges: A recorded encounter at sea.
The Criminal Centrality Metric
The authors introduce Criminal Centrality (CC). Unlike standard degree centrality which counts all neighbors, specifically counts a vessel's connections to known offenders (vessels on international wanted lists).
Where is the number of criminal neighbors. This allows the identification of "clean" reefers that are actually operating as major hubs for criminal organizations.
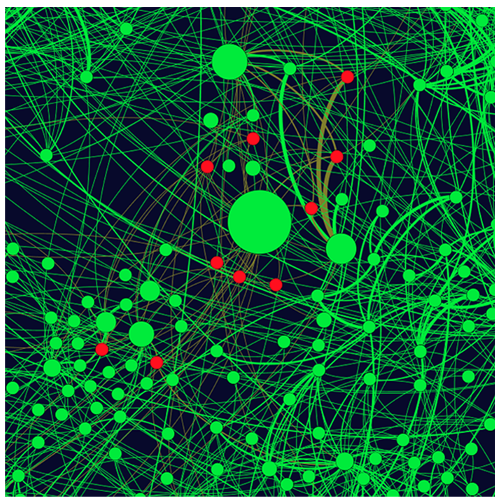 In the static model above, node size indicates criminal centrality. Zone 1 shows a small number of transshipment vessels handling the bulk of illegal traffic.
Static vs. Dynamic Analysis
The paper uses a dual-pronged approach:
- Static Analysis: Utilizes Gephi to flatten 6 years of data to find the most influential ships. It reveals two strategies: some criminals use the same hub repeatedly (Centralized), while others spread their catch across many different vessels (Decentralized).
- Dynamic Analysis: Utilizing a custom-built 3D-force-graph tool, the authors visualize how these ties form over time.
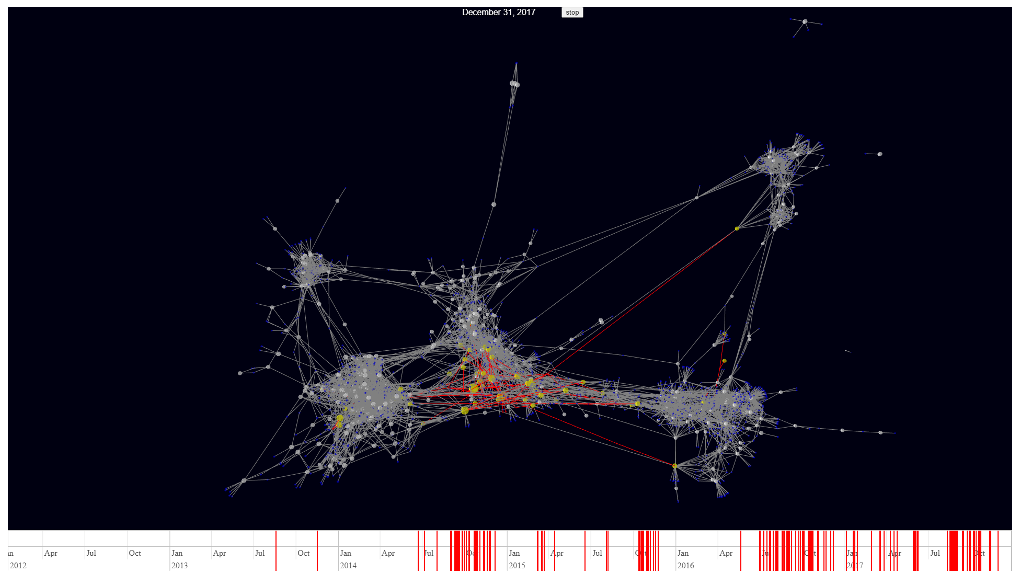 The dynamic tool shows the evolution of the global transshipment network from 2012 to 2017.
Key Insight: Topology Matters
One of the most profound findings is the difference in Network Topology:
- Planned Networks: Likely legal industrial operations. Most fishing vessels connect to exactly one reefer (Efficiency-focused).
- Emergent Networks: Characteristic of illegal operations. Fishing vessels connect to many different reefers, and there are often more reefers than fishing boats in a cluster.
This "inefficiency" suggests that illegal fishing is opportunistic. Criminals offload their catch to whoever is available and willing at that specific moment to minimize wait times and detection risks.
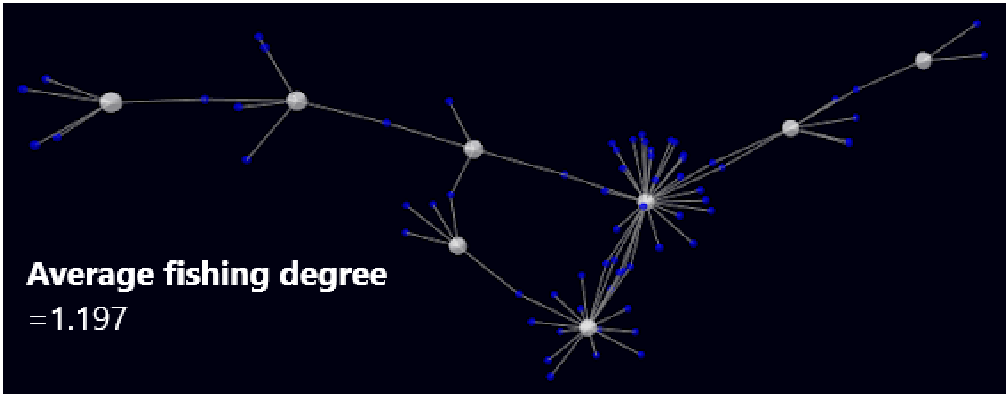 Figure 7 (center) illustrates the high-degree centrality of IUU fishing vessels—a clear sign of an "emergent" and illicit network structure.
Conclusion and Future Impact
By shifting the perspective from "where is this ship?" to "who does this ship know?", this research provides a powerful tool for maritime authorities.
The Takeaway: You don't need to catch a fishing boat in the act of illegal fishing if you can identify the transshipment "hubs" that facilitate the entire local industry. The authors plan to extend this to human trafficking and drug smuggling, where similar maritime patterns likely exist.
Limitations
The current study relies on a "known offender" list, which is a small subset of actual illegal activity. Future iterations should incorporate machine learning to predict which "clean" vessels are behaving like known criminals based on their movement patterns.