
StickViz: Navigating the 3D Intersection of Social Media, Space, and Time
StickViz: A New Visualization Tool for Phenomenon-Based k-Neighbors Searches in Geosocial Networking Services
StickViz is a novel 3D geovisualization tool designed for exploring Geosocial Networking Services (GSNS) through "phenomena-of-interest" based k-neighbor searches. By integrating spatial, temporal, and thematic dimensions into a 3D space-time cube, it enables users to identify clusters of people with similar interests relative to dynamic real-world events.
TL;DR
StickViz is a 3D geovisualization tool that moves beyond static 2D maps to help users find "k-neighbors"—people sharing similar interests—within dynamic, moving contexts. By defining a "Phenomenon of Interest" (e.g., the trajectory of a hurricane), StickViz allows users to search for relevant social content across spatial, temporal, and thematic dimensions simultaneously.
Context: This work bridges the gap between traditional Information Retrieval (IR) and "Neogeography," transforming how we visualize human activity within Geosocial Networking Services (GSNS).
The Limitation of the "Flat" Social Map
Most geosocial apps today ask a simple question: "What is happening near me right now?" This focus on the "current 2D slice" ignores the reality of human experience. Our interests are often tied to events that move through space over time (like a vacation or a natural disaster).
Existing systems typically separate these dimensions:
- Spatial: 2D Maps (Google Maps)
- Temporal: Chronological lists or timelines
- Thematic: Keyword search or hashtags
The challenge lies in the dynamic intersection. If you want to know what people were saying about "flooding" specifically as Hurricane Katrina moved along its path, a static 2D radius search is insufficient.
Methodology: The Space-Time Cube and Phenomena
The authors redefine human activity through Geointerests (Who, where, when, what) and Phenomena of Interest.
1. The 3D Geometries
Instead of a flat map, StickViz uses a Space-Time Cube where the Z-axis represents time. To model user queries, they use five distinct 3D volumes:
- Boxes/Tetrahedrons: For static or bounded areas.
- Tubes: To track "flocking" or movement (e.g., a travel route).
- Cones/Spheres: To model causality or the spread of an effect from a specific origin point.
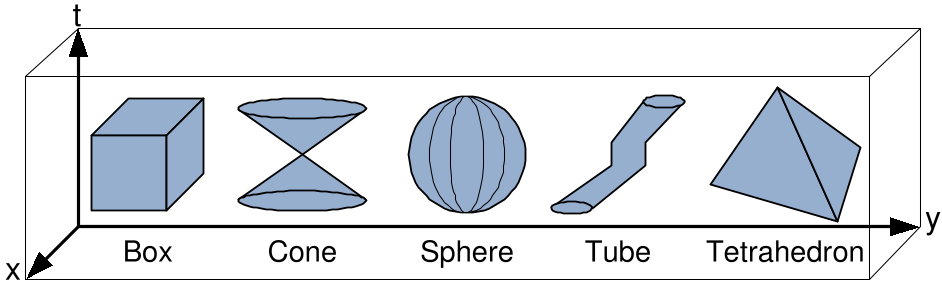 Figure: The five specialized space-time volumes used to define dynamic user queries.
2. The Search Algorithm
A k-neighbor query in StickViz follows a two-step verification:
- 3D Intersection (
STIntersect): Does a user's social post (a point/line in the cube) fall inside the defined 3D volume of the phenomenon? - Thematic Similarity (
Similar): Does the content of the post match the query keywords? This is calculated using TF-IDF weighting and Cosine Similarity.
Synthesis & Visualization
The system doesn't just return a list; it returns a "Human Cloud." This is a visual adaptation of a tag cloud where the size of a person's representation correlates to their "score"—how many relevant "geointerests" they have within the queried phenomenon.
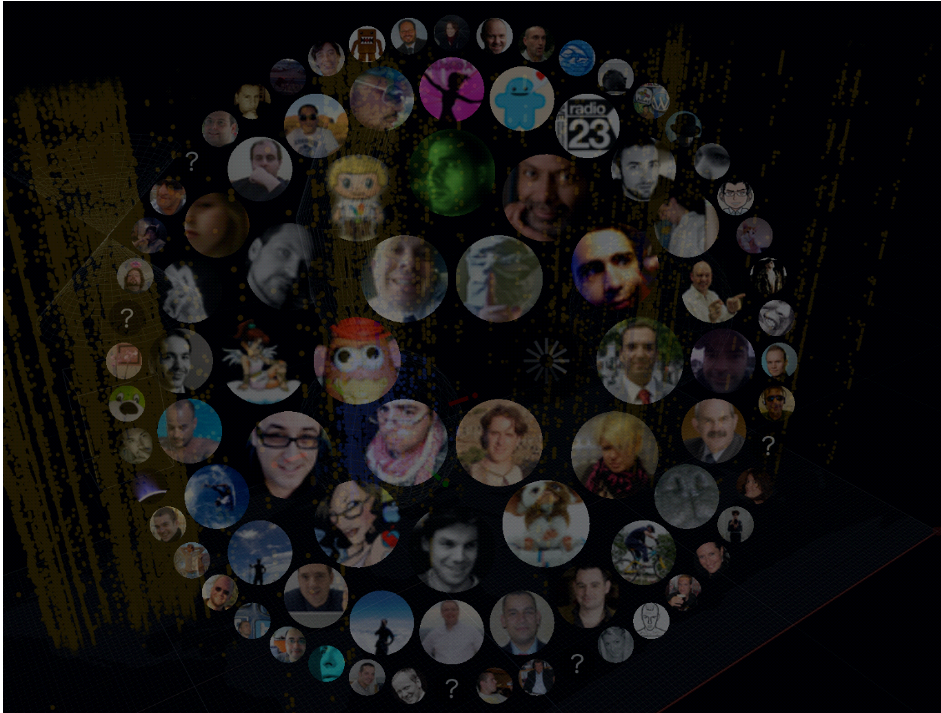 Figure: The Human Cloud displays top k-neighbors, allowing users to intuitively identify key contributors to a specific topic.
Critical Insight: Why This Matters
The brilliance of StickViz is in its unified query and presentation space. By forcing time, location, and topic into a single 3D visualization, it reduces the cognitive load on the user. They no longer have to mentally map a list of tweets to a map and then to a timeline.
Limitations & Future Outlook
While the 3D visualization is powerful, it faces the "occlusion" problem—where too many data points in a 3D space hide one another. The authors' plan to integrate more sophisticated IR methods and real-time web capabilities will be crucial for scaling this to the massive volume of modern platforms like X (Twitter) or Instagram.
Takeaway for Researchers: As we move toward a "Web Squared" era, the ability to model and query moving phenomena rather than static points will be the key differentiator for next-generation spatial analysis tools.