
Burn-In as Classification: Optimizing Reliability via Subpopulation Filtering
Stochastically Ordered Subpopulations and Optimal Burn-In Procedure
This paper develops an optimal burn-in procedure for repairable items by modeling a population as a mixture of "strong" and "weak" stochastically ordered subpopulations. It introduces a decision mechanism based on the number of failures during burn-in to minimize weighted classification risks and the expected number of repairs during field operation.
TL;DR
In high-stakes engineering, "burning in" a component is a standard way to weed out duds. This paper by Cha and Finkelstein moves beyond the simplistic "bathtub curve" assumption. By modeling the population as a mix of stochastically ordered strong and weak items, they provide a mathematical framework to decide exactly how long to test an item and how many failures should trigger a "discard" decision.
The Problem: The Bathtub Curve is a Myth
For decades, reliability engineers relied on the Bathtub Failure Rate curve. The idea was simple: high failure rates at the start (infant mortality), a flat bottom (stable life), and a rising tail (wear-out).
However, modern data shows that the bathtub shape applies to less than 15% of real-world scenarios. The authors argue that high initial failure rates aren't just a "phase"—they are the signature of a weak subpopulation (defective components, human error in assembly, etc.) lurking among the strong ones. If we treat every failure the same, we might over-test strong components or under-screen weak ones.
Methodology: Filtering via Failure Counts
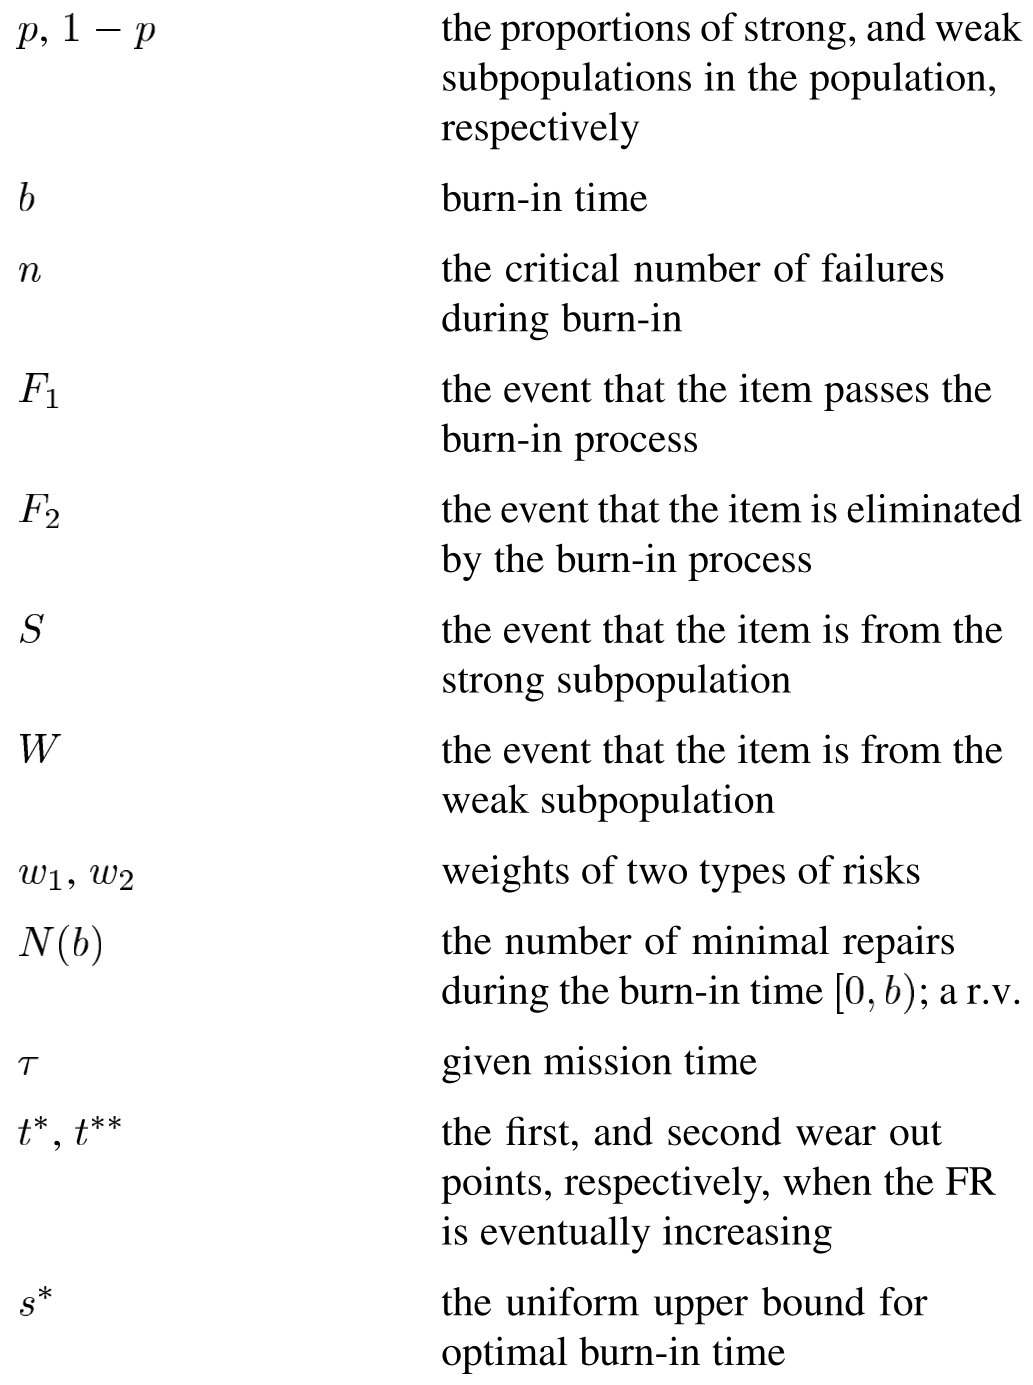
The authors propose a Burn-in Procedure with Minimal Repair. Unlike traditional models that only look at time, this model looks at the number of failures ().
The Intuition
Imagine you have two types of lightbulbs: "Long-life" (Strong) and "Cheap" (Weak).
- The Model: If the weak subpopulation has a failure rate and the strong has , we assume (Stochastic Ordering).
- The Test: We run the item for a time .
- The Rule: If the item fails more than times during this period, we categorize it as "Weak" and junk it. If not, it ships to the customer.
Mathematical Insight
The failures are modeled as a Non-Homogeneous Poisson Process (NHPP). The authors define two risks:
- Type I Risk: A strong item is accidentally discarded.
- Type II Risk: A weak item "sneaks through" to the field.
The optimal is found by minimizing a weighted sum of these risks.
Strategic Optimization: Time vs. Rejection
The paper doesn't just solve for ; it solves for the joint optimization of time () and rejection count (.
The goal is to minimize the expected repairs in the field. This is vital for "mission-critical" systems (like military gear) where failures in the field are far more expensive than failures in the lab.
Key Theorem: The Uniform Upper Bound
The authors prove that if the failure rate is "eventually increasing" (wear-out happens eventually), there exists a maximum sensible burn-in time . Spending any more time than is mathematically guaranteed to be a waste of resources, regardless of how many failures occur.
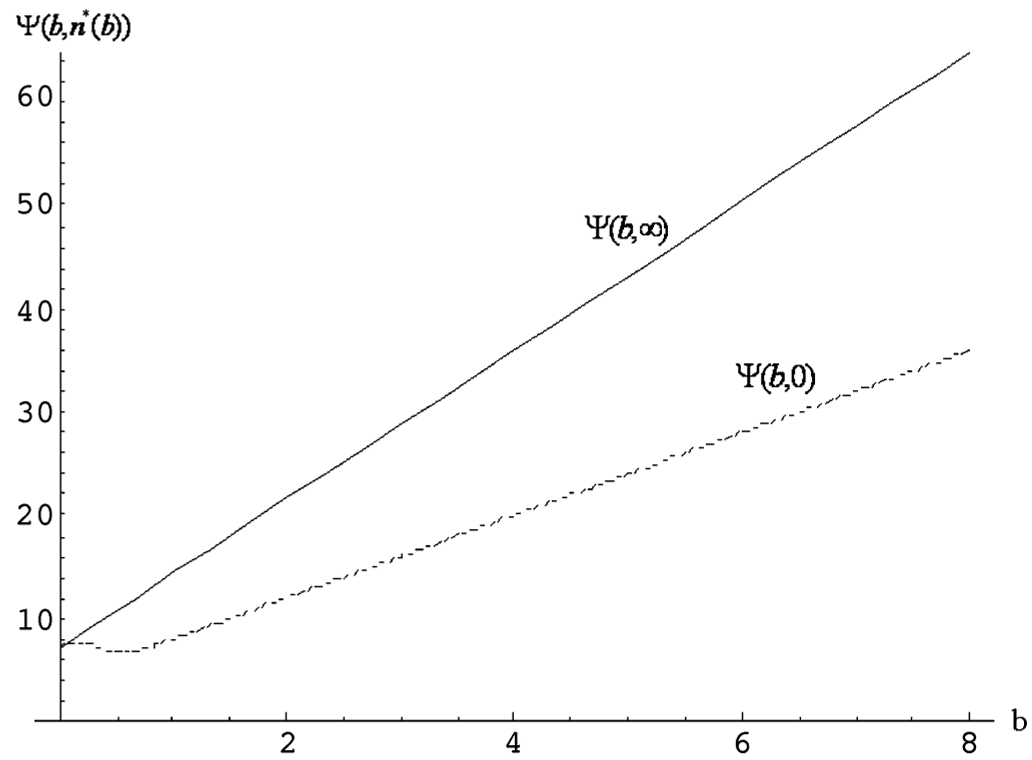 Figure 1: Numerical analysis showing the relationship between burn-in time () and the expected number of field repairs. Note the optimization point where field failures are minimized.
Critical Analysis & Conclusion
The value of this work lies in its robustness. By using stochastic ordering rather than specific parametric distributions (like only Weibull), the model is applicable to a wider range of engineering hardware.
Takeaway for Engineers:
- Don't just watch the clock: Monitor the frequency of failures during the testing phase.
- Know your mix: The optimal strategy changes based on the proportion of strong vs. weak items. If your manufacturing line is very dirty (low ), your burn-in must be more aggressive.
Limitations:
The model assumes "Minimal Repair" (fixing just enough to work again, but not "new"). In cases of "Major Repair" or total replacement, the underlying Poisson process logic would need to shift to a Renewal Process, which is significantly more complex to solve analytically.
Future Outlook: Integrating these models with real-time sensor data and machine learning (anomaly detection) could allow for "Adaptive Burn-in," where the test duration is adjusted on-the-fly for every individual unit.