
Sentiment in the Stacks: Decoding Market Movements via Twitter and StockTwits
A Methodology for Stock Movement Prediction Using Sentiment Analysis on Twitter and StockTwits Data
This paper proposes a methodology for predicting stock price movements by integrating sentiment analysis from Twitter and StockTwits with historical financial data. Utilizing SVM and Logistic Regression models, the study achieves a top F-score of 76.3% and an AUC of 67% for Microsoft (MSFT) stock movement prediction.
TL;DR
Can the collective "noise" of social media actually predict the stock market? This research presents a methodology that sifts through thousands of tweets and StockTwits posts to forecast Microsoft's stock trajectory. By combining lexicon-based sentiment analysis (VADER, TextBlob) with Machine Learning (SVM), the study achieves an impressive 76.3% F-score, proving that public mood is a potent lead indicator for financial shifts.
The Motivation: Moving Beyond the Balance Sheet
Financial prediction has evolved through three major eras:
- Fundamental Analysis: Reading the annual reports.
- Technical Analysis: Finding patterns in historical price charts.
- The Sentiment Era: Using AI to gauge the "wisdom of the crowd."
The authors argue that while technical data tells us what happened, sentiment data explains the why—capturing the human emotions of fear and greed that trigger market fluctuations. The challenge lies in the data's messiness: how do we turn a sarcastic tweet or a bot-generated ticker spam into a reliable trade signal?
Methodology: The Fusion Pipeline
The paper outlines a rigorous data processing workflow designed to bridge the gap between unstructured text and rigid financial intervals.
1. Dual-Source Sentiment Mining
The study distinguishes between two distinct crowds:
- Twitter: Represents the general public's perception of products and brand health.
- StockTwits: A dedicated community of traders providing expert-level, signal-dense commentary.
2. The Tech Stack
The authors utilized VADER (specifically tuned for social media "slang") and TextBlob. These scores were merged with historical Yahoo Finance data ($MSFT).
3. Architecture & Pre-processing
A critical step in the methodology was Outlier Removal and Linear Interpolation. Since stock markets close on weekends but social media never sleeps, the authors used interpolation to align the datasets, ensuring a continuous time-series for the ML models.
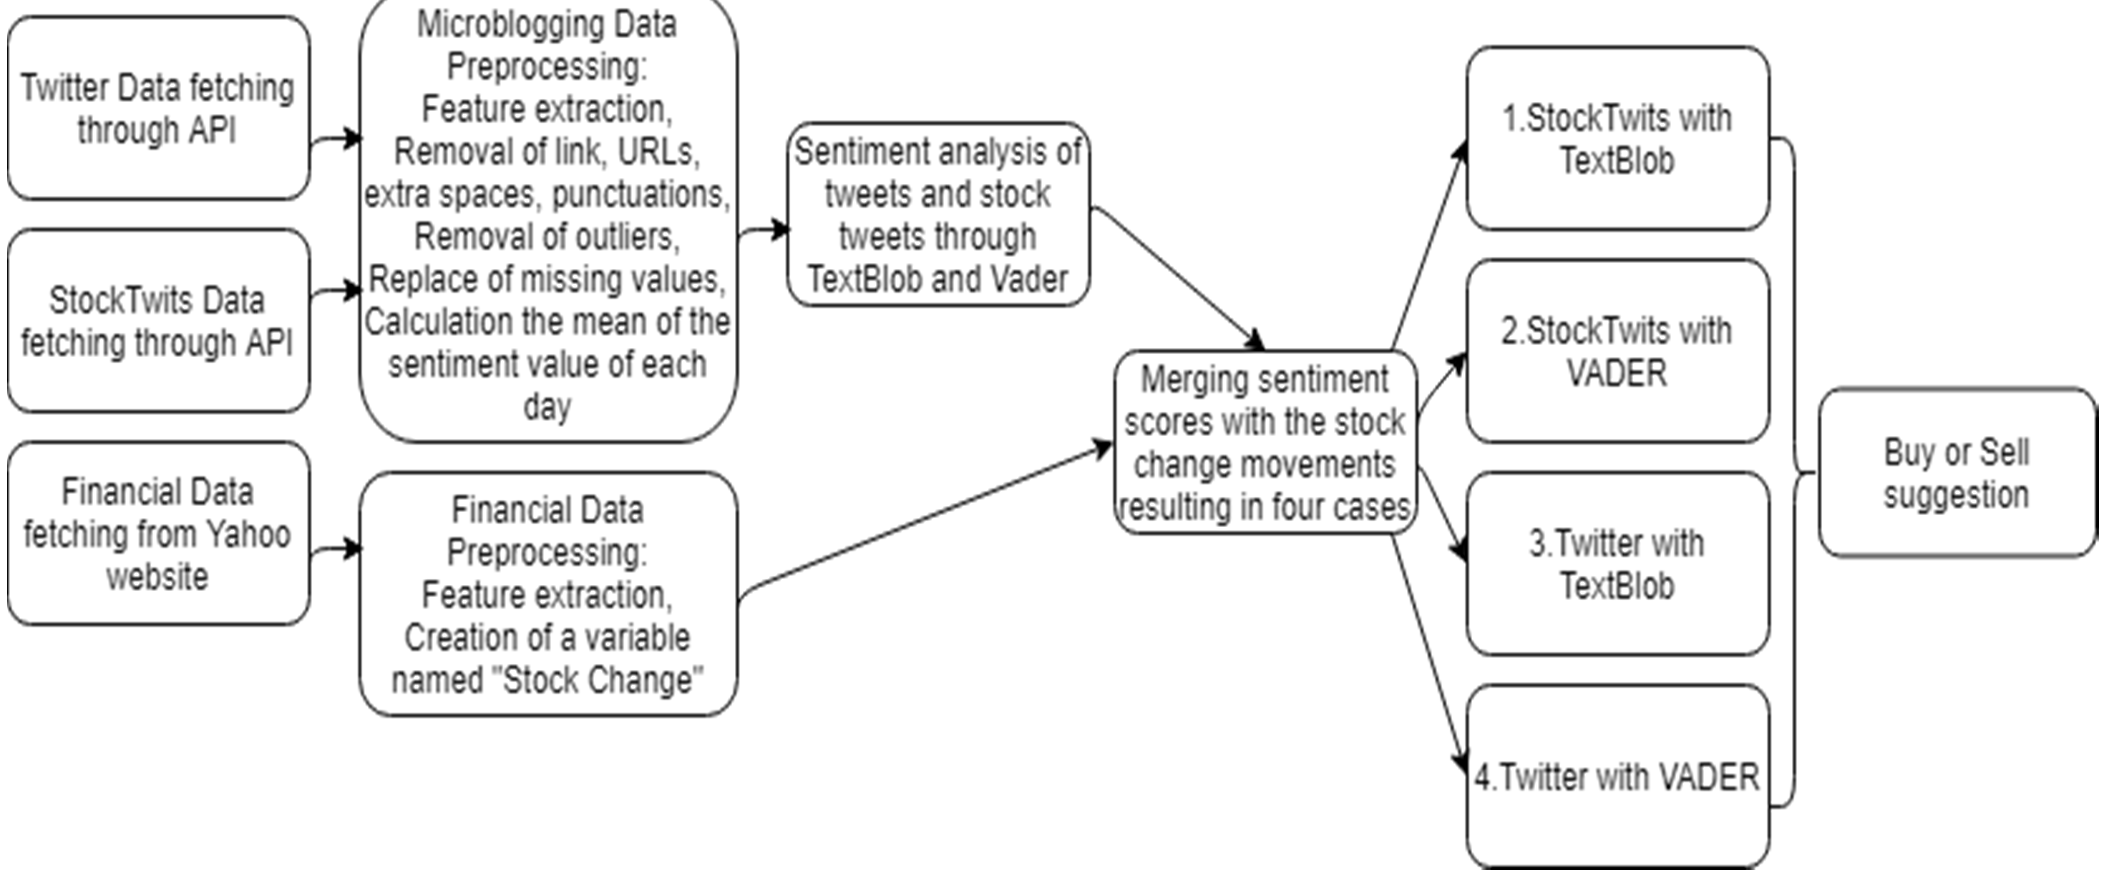 Figure 1: The proposed pipeline from raw API extraction to final classification.
Experimental Results: SVM Takes the Crown
The researchers compared Support Vector Machines (SVM) and Logistic Regression. The results were telling:
- The VADER Advantage: VADER proved superior to TextBlob when paired with Twitter data. This is likely due to VADER's ability to handle the intensity of social media language (e.g., capitalization and punctuation as sentiment boosters).
- Metric Realism: Because the dataset was imbalanced (more people buy/hold Microsoft than sell it), traditional 'Accuracy' was misleading. The authors focused on F-score and AUC to prove the model's true discriminatory power.
 Table 1: SVM achieved the peak F-score of 76.3% using Twitter+VADER, significantly outperforming baseline expectations.
Critical Insights & Future Outlook
Why did it work?
The success of the SVM model suggests that stock movements are not purely random; they often follow a "Sentiment Momentum." When the synthesized compound score from VADER crosses a certain threshold, the probability of a price shift increases significantly.
Limitations & The Path Forward
Despite the success, the authors identify key hurdles for future research:
- The "Influencer" Weight: Not all tweets are equal. A post from a Tier-1 analyst should carry more weight than a random bot. Future models should incorporate "Follower Count" as a feature.
- Linguistic Nuance: Current tools like TextBlob sometimes miss sarcasm. The next logical step is using LLMs (like GPT or FinBERT) to understand deeper context.
- Data Scarcity: Twitter's API limits (7-day history for free accounts) remain a bottleneck for long-term historical backtesting.
Final Takeaway
This paper provides a robust blueprint for retail investors and data scientists looking to quantify "market vibe." By treating social platforms as a giant, real-time focus group, we can move closer to predicting the unpredictable.