
Precise Roughness Sampling: The Key to Unlocking Accurate SAR Backscatter Modeling
Influence of Surface Roughness Sample Size for C-Band SAR Backscatter Applications on Agricultural Soils
This study investigates the impact of surface roughness sample size on C-band SAR backscatter modeling in agricultural soils. By analyzing ENVISAT/ASAR data and laser-profiled roughness parameters (s and l), the researchers identify the minimum profile requirements for accurate microwave scattering simulations using IEM, GOM, and Oh models.
TL;DR
Accurate Synthetic Aperture Radar (SAR) applications in agriculture hinge on how we measure Soil Surface Roughness (SSR). This research demonstrates that while the standard deviation of surface height () can be reliably estimated with 10–15 one-meter profiles, the correlation length () is far more elusive, often staying unstable even after 20 samples. This variability directly dictates the success of backscatter models, with the semi-empirical Oh model outperforming physically-based counterparts like IEM and GOM under typical field sampling constraints.
Context & Motivation: The Complexity of the "Rough" Earth
In microwave remote sensing, the backscatter coefficient () is primarily driven by soil moisture (SM) and SSR. For decades, researchers have struggled with the "parameterization problem": roughness is a multiscalar phenomenon. A measurement taken over 1 meter might look completely different from one taken over 5 meters.
The authors identify a critical gap: it is not just how we measure (instrumentation), but how much we measure (sample size). Incomplete sampling leads to "noisy" roughness parameters, which propagate through non-linear backscatter models, making soil moisture retrieval nearly impossible.
Methodology: Testing the Scale of Observation
The study utilized ten ENVISAT/ASAR scenes and an extensive ground campaign in Navarre, Spain. The researchers used a 5-meter laser profiler, breaking down measurements into 635 individual 1-meter profiles.
They tested three pillars of SAR modeling:
- IEM (Integral Equation Model): Physically-based, used for smoother surfaces.
- GOM (Geometrical Optics Model): Physically-based, used for very rough surfaces.
- Oh Model: A semi-empirical model that relates backscatter to and moisture without relying as heavily on the often-erroneous .
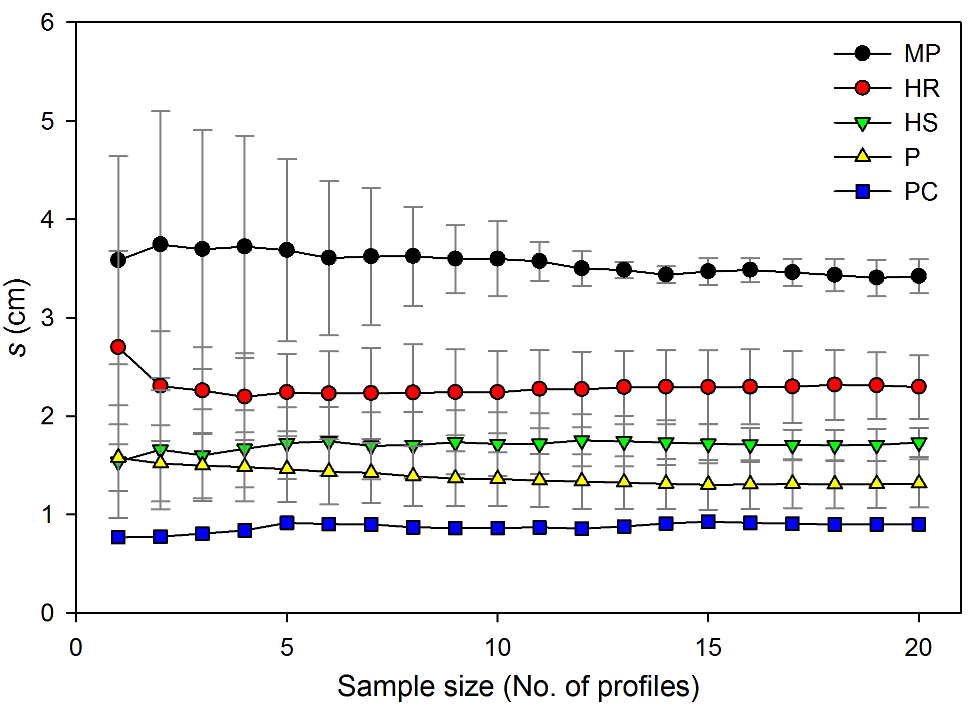 Fig 1: Relative stability of standard deviation (s) vs. the high variance of correlation length (l) as sample size increases.
Key Insights: Why Your Backscatter Simulations Might Be Failing
The findings reveal a stark contrast between the two primary roughness parameters:
- The Stability of : The standard deviation of heights becomes statistically representative relatively quickly. With 12+ profiles, the correlation between and normalized backscatter reaches a stable .
- The Fragility of : Correlation length is notoriously difficult to capture. Even with 20 samples, class variability remains high. Since physical models like IEM and GOM are highly sensitive to , their performance is inherently capped by measurement logistics.
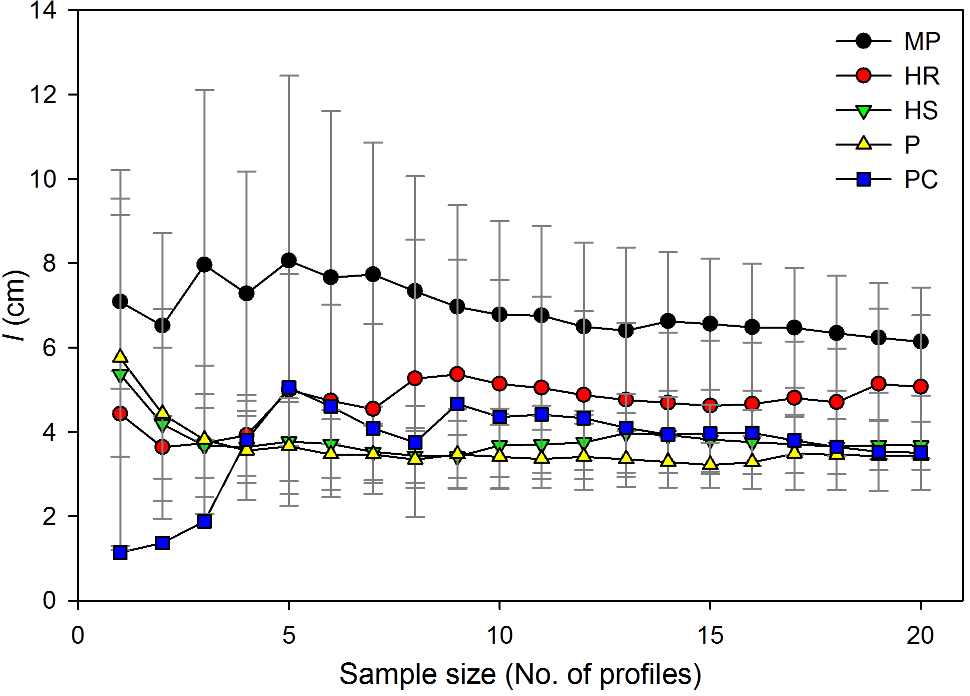 Fig 2: Spearman correlation between backscatter and parameters. Note how correlation "plateaus" only after significant sampling.
Experimental Results: Oh Model vs. The Rest
The experiment compared simulated against observed SAR data.
- RMSE Reduction: Increasing profiles from 5 to 15 reduced RMSE in physical models by approximately 1.5 dB.
- The Winner: The Oh model proved far more resilient. It achieved an RMSE of 1.0–2.0 dB across most tillage types (Planted, Harrowed, Ploughed). Because it is less reliant on the volatile parameter, it provides a more "forgiving" framework for operational SAR applications where high-density sampling is cost-prohibitive.
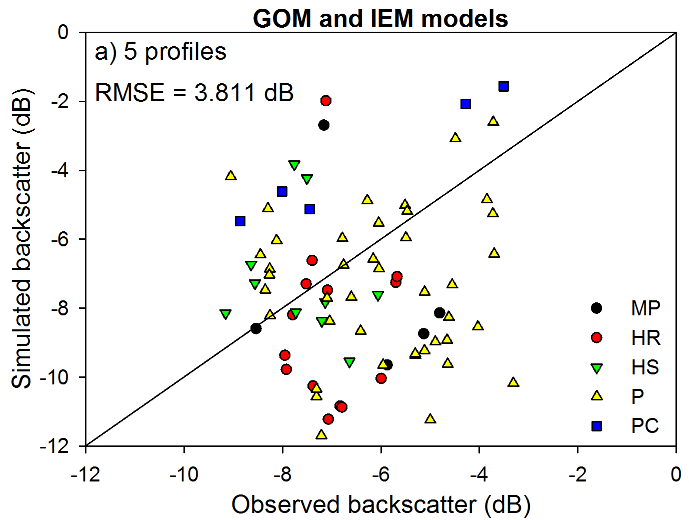 Fig 4: Scatter plots comparing Model predictions vs. Satellite observations. The bottom row (Oh Model) shows tighter clustering and better fit.
Critical Analysis & Conclusion
This paper provides a pragmatic "User Manual" for field scientists.
- Don't skimp on sampling: If you are using C-band SAR, aim for at least 15 independent 1-m profiles per field.
- Model Selection Matters: If your correlation length data is shaky (which it likely is), avoid the IEM/GOM in favor of the Oh model or other semi-empirical alternatives.
Limitations: The study focuses on 1-m profile lengths. While sufficient for C-band, longer-wavelength sensors (like L-band or P-band) may require even longer profiles to account for larger-scale roughness components.
Future Outlook: The trend in the industry is moving toward "effective" roughness parameters derived from SAR data itself to bypass the labor-intensive ground sampling described here. However, this study remains a foundational benchmark for validating those "model-derived" parameters against physical reality.