
Decoding the Social Pulse: A Survey on Visual Analytics of Social Media Data
A Survey on Visual Analytics of Social Media Data
This paper presents a comprehensive survey of visual analytics for social media data, categorizing state-of-the-art techniques into two primary domains: gathering information and understanding user behaviors. It establishes a unified taxonomy and framework for analyzing large-scale, heterogeneous social streams like Twitter and Facebook.
TL;DR
Social media is no longer just a communication tool; it is a real-time sensor of global human dynamics. However, the sheer "noise" and "velocity" of platforms like Twitter make manual analysis impossible. This survey by Wu et al. provides a rigorous taxonomy for Visual Analytics (VA)—a field that combines computational power with human intuition to navigate the chaos of social data.
Problem & Motivation: The 3V Challenge
The core difficulty of social media data lies in the Heterogeneity-Network Interdependence. Unlike traditional databases, a tweet isn't just text; it contains metadata, images, and is embedded within a shifting network of retweets and mentions.
Current automated algorithms often fall short because:
- Context is King: Algorithms struggle with sarcasm, slang, and cultural nuances.
- Trustworthiness: How do we distinguish a viral rumor from a breaking news event?
- Scalability: Processing 500 million tweets daily requires more than just a powerful backend—it requires a way for humans to "see" the patterns without drowning in dots.
Methodology: The Two Pillars of Social GA/UB
The authors organize the research landscape into two distinct but overlapping pillars:
1. Gathering Information (The "What")
This involves filtering the ocean to find the drops that matter.
- Keyword vs. Topic-Based: While simple keywords (Visual Backchannel) work for specific events, modern methods use Latent Dirichlet Allocation (LDA) to discover "latent" topics that users never explicitly named.
- Multi-faceted Retrieval: Tools like TwitInfo aggregate sentiment, geography, and volume peaks to provide situational awareness during crises.
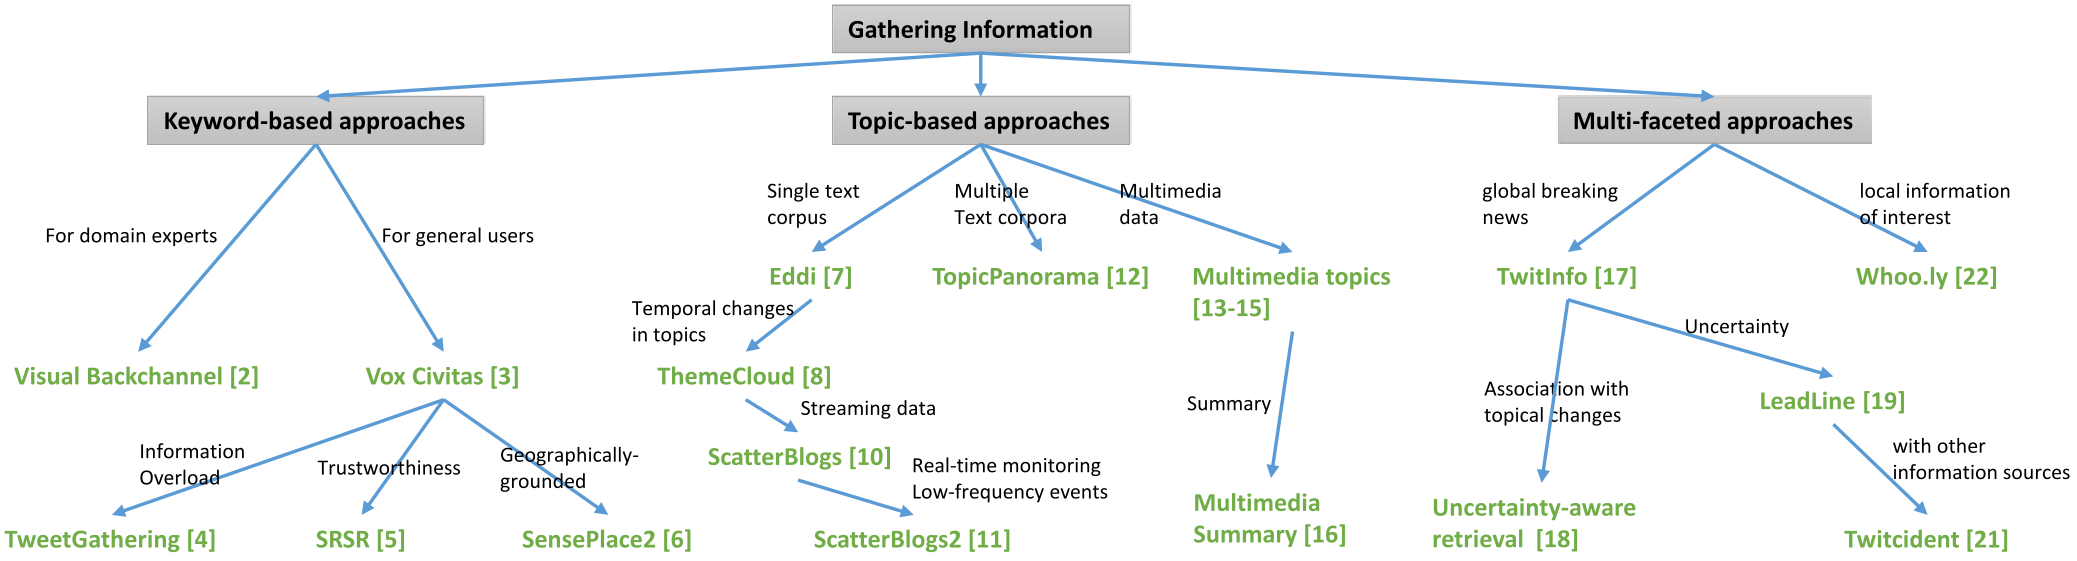 Figure 1: The flow from raw social streams to structured visual representation.
2. Understanding User Behaviors (The "Who" and "How")
This segment shifts the focus from content to the dynamics of the crowd.
- Information Diffusion: How does a meme or a rumor spread? Systems like Whisper use a sunflower metaphor to trace the spatiotemporal process of retweets in real-time.
- Coopetition (Competition + Cooperation): Visualizing how different topics or opinions vie for public attention using flow-style visualizations (e.g., EvoRiver).
- Ego-Centric Portraits: Using glyph-based designs (Episogram) to create a "digital portrait" of individual user activity, helping to spot bots or anomalous influencers.
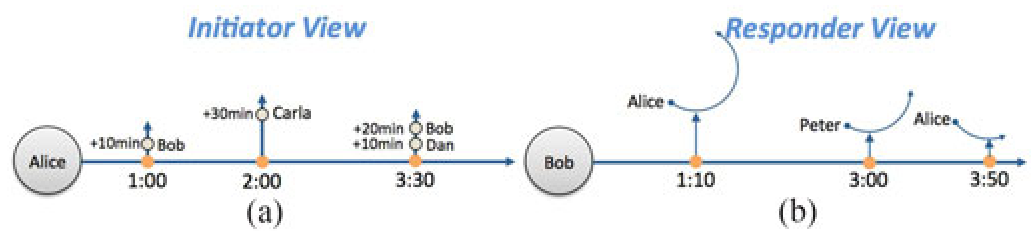 Figure 2: The Episogram design for summarizing egocentric social interactions.
Experiments & Results: Success Stories in VA
The paper highlights several SOTA achievements:
- Anomaly Detection: FluxFlow demonstrates how visual packing and anomaly scores can help analysts identify rumors significantly faster than traditional list-based monitoring.
- Hybrid Networks: NodeTrix solves the "hairball" problem of large networks by combining node-link diagrams with adjacency matrices, allowing for both global and local structural analysis.
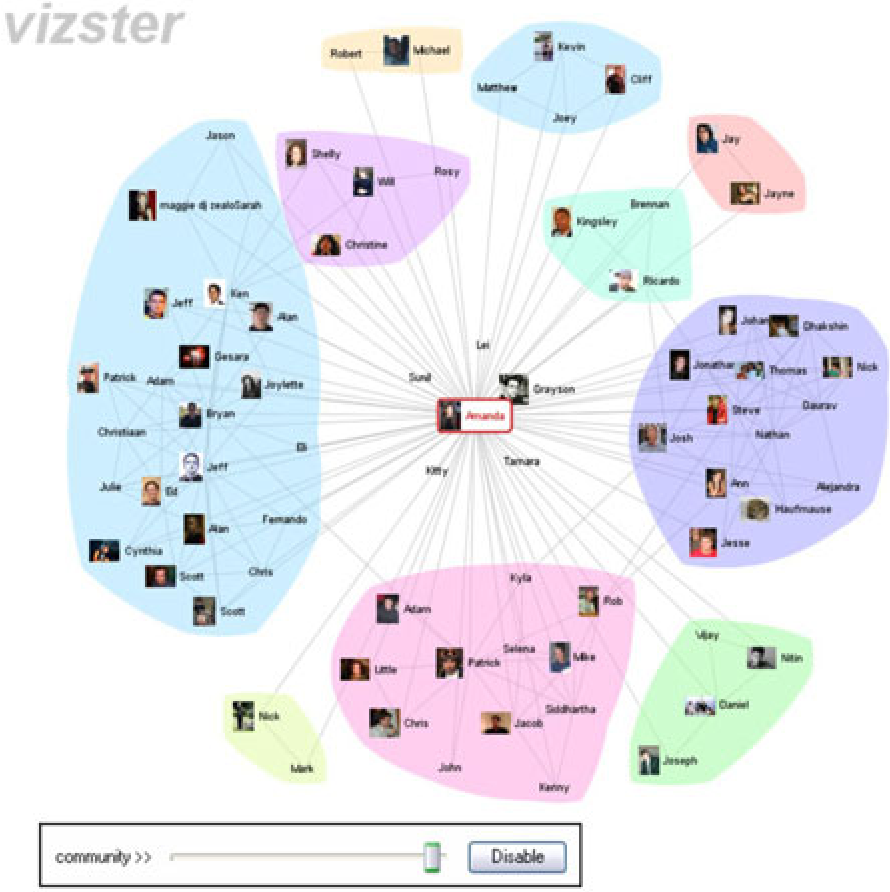 Figure 3: NodeTrix's hybrid approach for high-density social network visualization.
Critical Analysis & Future Outlook
While the survey is comprehensive, the authors acknowledge several "bottlenecks" that remain:
- Visual Uncertainty: We need better ways to tell the user "I am only 60% sure this cluster is about Politics."
- Multimedia Gaps: Most current tools still treat images as "extra" rather than core features. Future VA must leverage computer vision to analyze the content of shared images as deeply as we do text.
- The Scalability Wall: As we approach the era of "Deep Social Analysis," handling billions of nodes at interactive speeds requires a fundamental rethink of the rendering pipeline.
Final Takeaway
Visual Analytics is the bridge between silent algorithms and overwhelmed humans. By formalizing this taxonomy, Wu et al. provide the roadmap for the next generation of social intelligence tools—moving from "seeing what happened" to "understanding why it spread."