
Modeling the Tipping Point: A System Dynamics Approach to South Africa’s Prediabetes Crisis
A system dynamics approach to modelling the management of the increased prediabetic prevalence of the South African population
This paper presents a System Dynamics (SD) model to evaluate management strategies for the rising prediabetic prevalence in South Africa. Utilizing a causal loop diagram (CLD) and stock-and-flow modeling, it identifies "increased screening of high-risk individuals" as the most effective intervention for reducing the prediabetic population.
TL;DR
With over 5 million South Africans estimated to be prediabetic and only 10% diagnosed, the healthcare system faces a ticking time bomb. This research moves beyond static statistics to use System Dynamics (SD) modeling, discovering that while education is cheap, targeted screening is the only intervention powerful enough to significantly reverse the growth of the prediabetic population.
Background Positioning
In the landscape of public health research, this paper sits at the intersection of Epidemiology and Systems Engineering. Rather than a clinical trial, it is a policy-simulation tool designed to help the South African Department of Health navigate the "non-linear" complexities of a dualized (private vs. public) health system.
Problem & Motivation: The Invisible Epidemic
South Africa suffers from a "double burden" of disease: high rates of communicable diseases (HIV/TB) alongside a surging non-communicable disease (NCD) crisis. The authors identify a critical gap: 61.1% of diabetics in the country are undiagnosed. By the time symptoms appear, complications like kidney failure or amputation are often inevitable.
The authors' insight is that prediabetes management is a dynamic complexity problem characterized by long delays between cause (lifestyle/screening) and effect (diabetes onset). Current policies are often reactive; this paper seeks a proactive lever.
Methodology: Mapping the Feedback Loops
The core of the study is a Causal Loop Diagram (CLD) that translates social and clinical interactions into mathematical relationships.
The Six-Dynamic Hypothesis
The researchers identified key loops that govern the system:
- R1, R2, R3 (Reinforcing Loops): These involve clinician effectiveness and access. If a clinician is overwhelmed, the quality of check-ups drops, decreasing the diagnosis rate.
- B1, B2, B3 (Balancing Loops): These involve public health motivation. Interestingly, a decrease in prediabetic numbers might lower the Department of Health’s motivation to fund education, creating a "pendulum" effect that allows the disease to surge again.
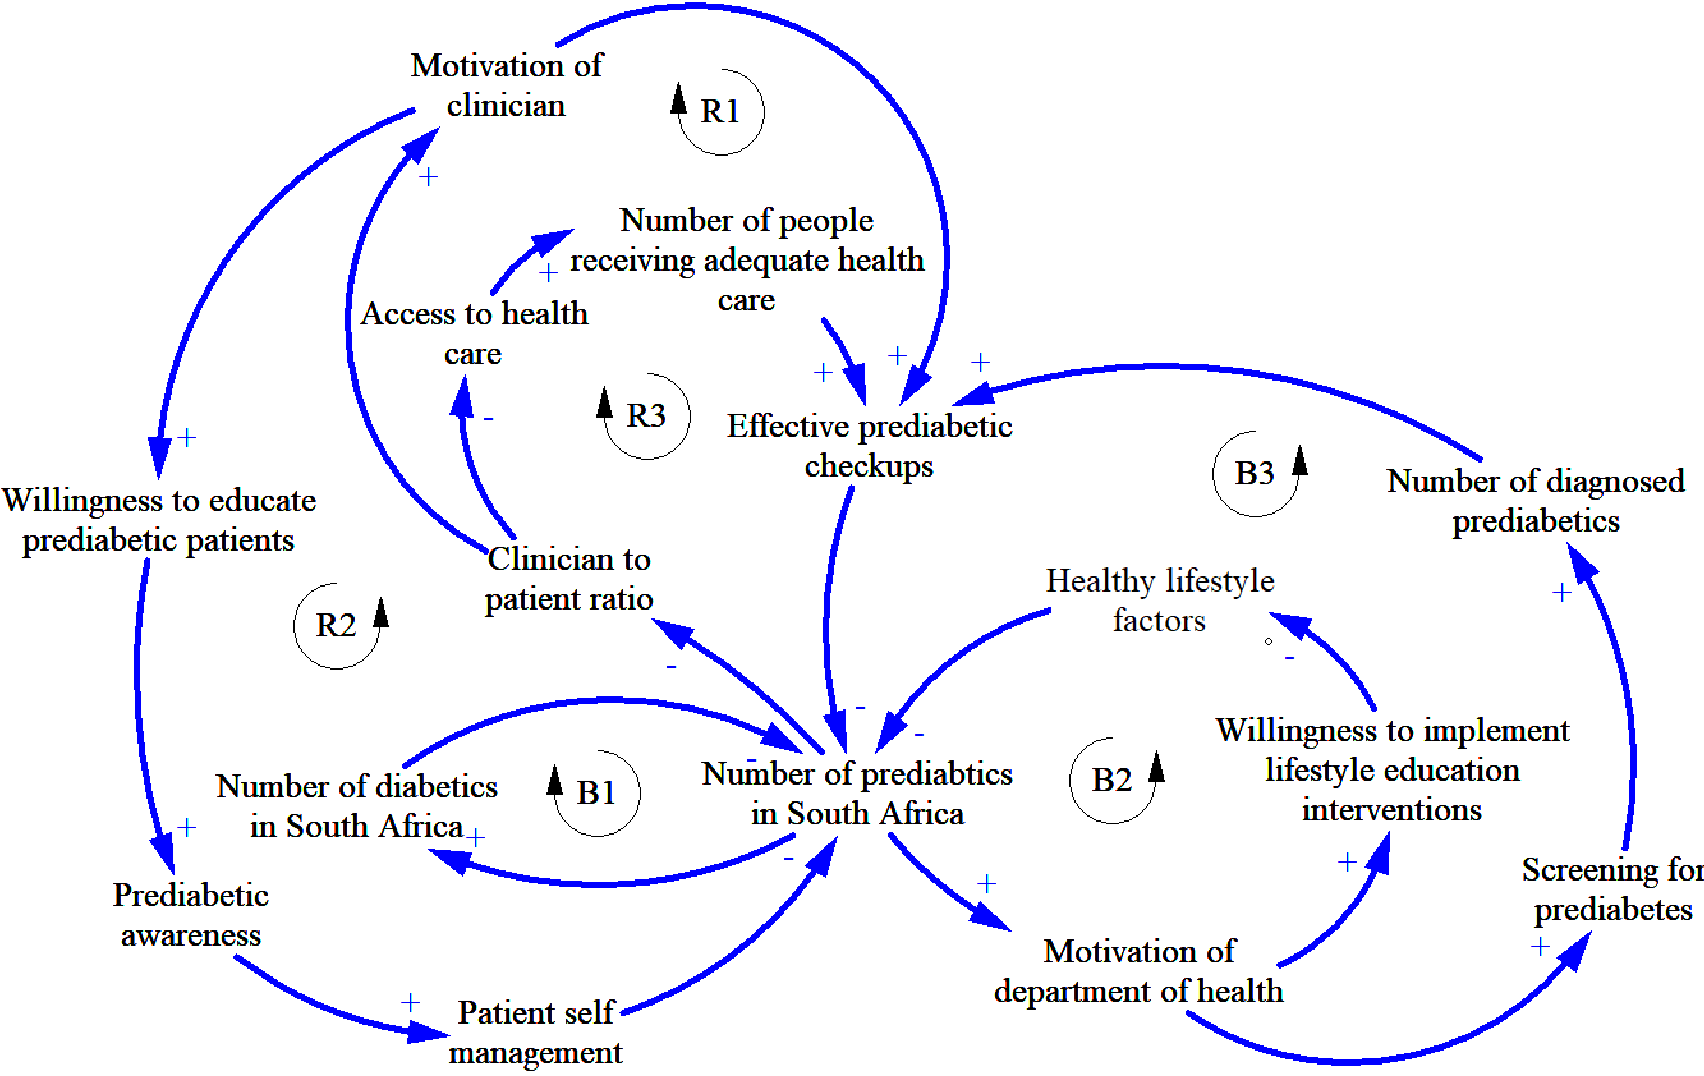 Fig 1. The complex web of interactions: Causal Loop Diagram for South African Prediabetes Management.
The Stock and Flow Model
The authors then converted these loops into a Stock and Flow model (developed in Vensim). This treats the South African population as "water" flowing through three tanks: Normoglycaemia Prediabetes Diabetes.
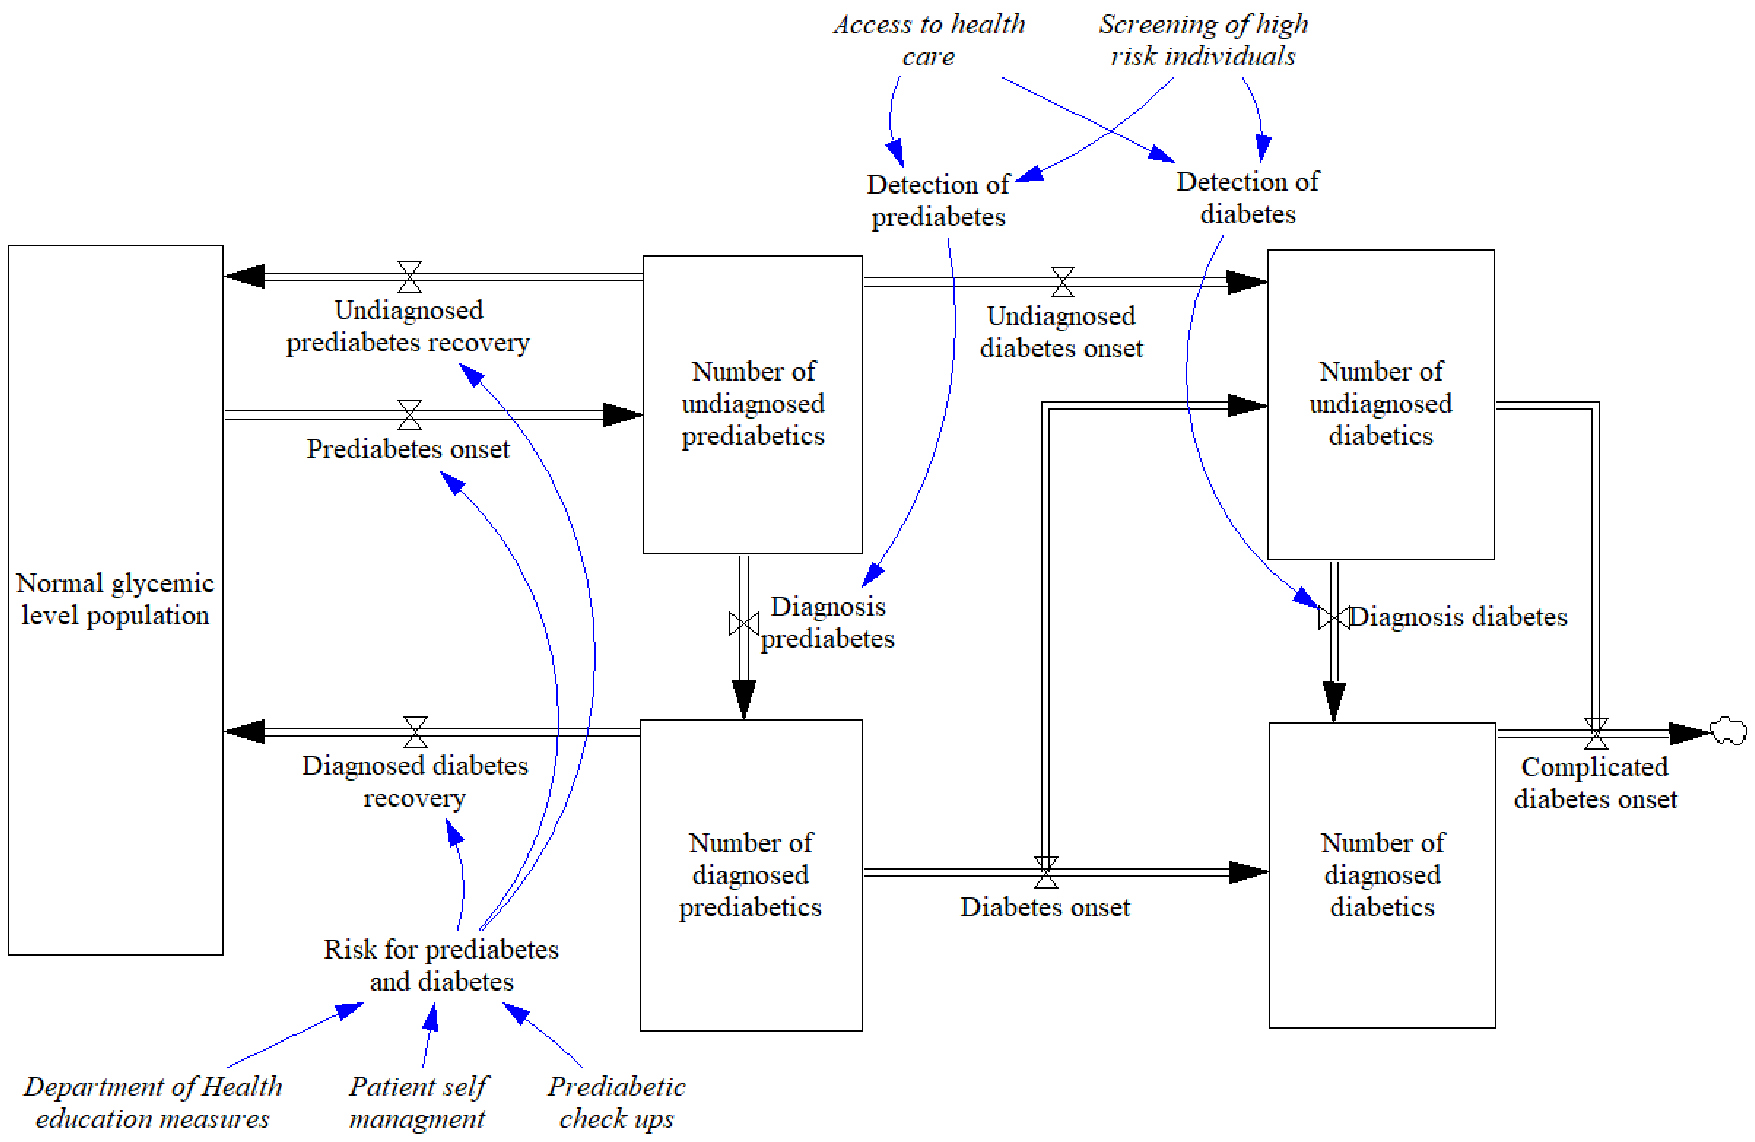 Fig 2. The mathematical engine: Primary population stocks and the levers (flows) that can be modified by policy.
Experiments & Results: Screening is the Silver Bullet
The team tested five scenarios:
- Clinician-to-patient ratio
- Check-up effectiveness
- Lifestyle intervention education
- Self-management education
- Prediabetic screening
The Findings
Counter-intuitively, Lifestyle Education showed almost no effect on the undiagnosed population when used in isolation. The most dramatic results came from Scenario 5 (Prediabetic Screening).
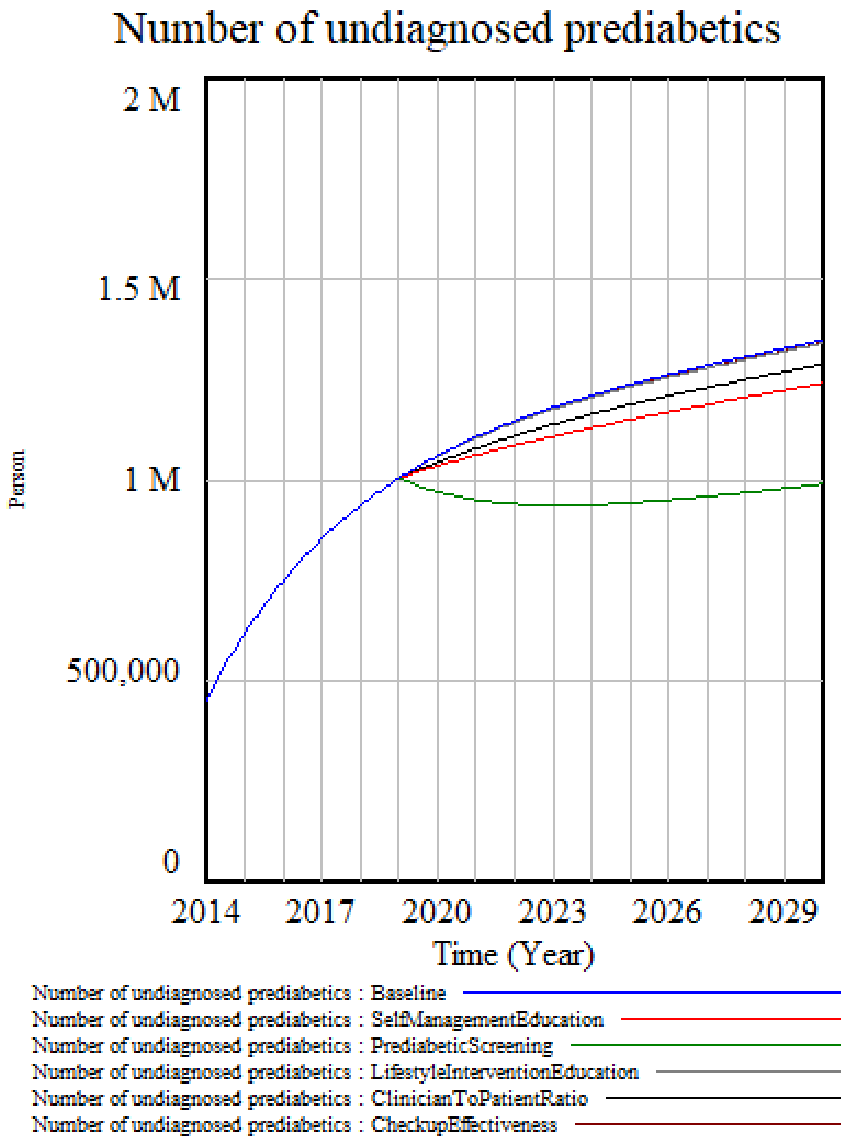 Fig 3. High Variable Increase results: Notice how Prediabetic Screening (represented in the scenarios) shows the steepest reduction in the undiagnosed population compared to the baseline.
While screening is expensive (approx. $206/individual), the model highlights that it is the primary mechanism to move individuals from the "Undiagnosed" stock to the "Diagnosed" stock, where management can actually begin.
Critical Analysis & Conclusion
Takeaway
The research concludes that South Africa cannot "educate" its way out of the diabetes crisis without first identifying the at-risk population. High-risk screening must be the cornerstone of policy, supplemented by low-cost self-management education to ensure those diagnosed don't progress to full diabetes.
Limitations
- Remission Omitted: The model doesn't account for patients who revert from full diabetes to normoglycemia (remission), which could slightly overestimate the permanent diabetic stock.
- Static Death Rates: Mortality was modeled on averages rather than dynamic factors, which might miss the impact of healthcare improvements on longevity.
Future Outlook
The authors suggest that future models should include "Diabetes with Complications" as a variable to see the long-term economic savings of early prediabetic screening. This work serves as a vital blueprint for shifting South African health policy from curative to preventative.