
The Big Picture of BIM: Beyond Linear ROI with System Dynamics
Looking at the big picture of IS investment appraisal through the lens of systems theory: A System Dynamics approach for understanding the economic impact of BIM
This paper introduces a novel quantification model for Building Information Modelling (BIM) investment appraisal using a System Dynamics (SD) approach underpinned by systems theory. By applying Design Science Research (DSR), it successfully moves beyond project-level ROI to a holistic corporate-level economic impact analysis, achieving a simulated Net Profit 15x higher than the baseline in a 20-year long-term projection.
TL;DR
Quantifying the value of Building Information Modelling (BIM) has long been a headache for the AEC industry. This paper moves the needle by applying Systems Theory and System Dynamics, proving that while BIM is a "heavy" investment upfront, its systemic impact on productivity, customer satisfaction, and employee retention can lead to a 15-fold increase in net profit over 20 years.
The Problem: The "Small Picture" Trap
For years, construction firms have evaluated BIM using simple, linear ROI calculations—usually focusing on a single project's cost savings. This technical-only focus ignores the socio-technical reality:
- Intangibles are ignored: How do you value "improved corporate image" or "employee satisfaction"?
- Linearity is a lie: In the real world, costs and benefits don't move in straight lines; they involve feedback loops and delays.
- The Ex-Post Bias: Most studies look backward (ex-post). Managers need a way to look forward (ex-ante) before they sign the check.
Methodology: Mapping the Corporate Ecosystem
The authors propose that a company is not a collection of isolated parts, but a system of interrelated subsystems. They used System Dynamics (SD) to model three core areas:
- Personnel and Labour: Skills training, injury reduction, and staff turnover.
- Customer and Market: Output quality, reputation, and order frequency.
- Finance and Accounting: Revenue, depreciation, debt, and net profit.
The Feedback Loop Logic
Unlike a spreadsheet, the SD model recognizes that Training has a dual effect: it temporarily lowers productivity (cost) but eventually increases "Training Efficiency" and "Skills," which reduces errors (benefit).
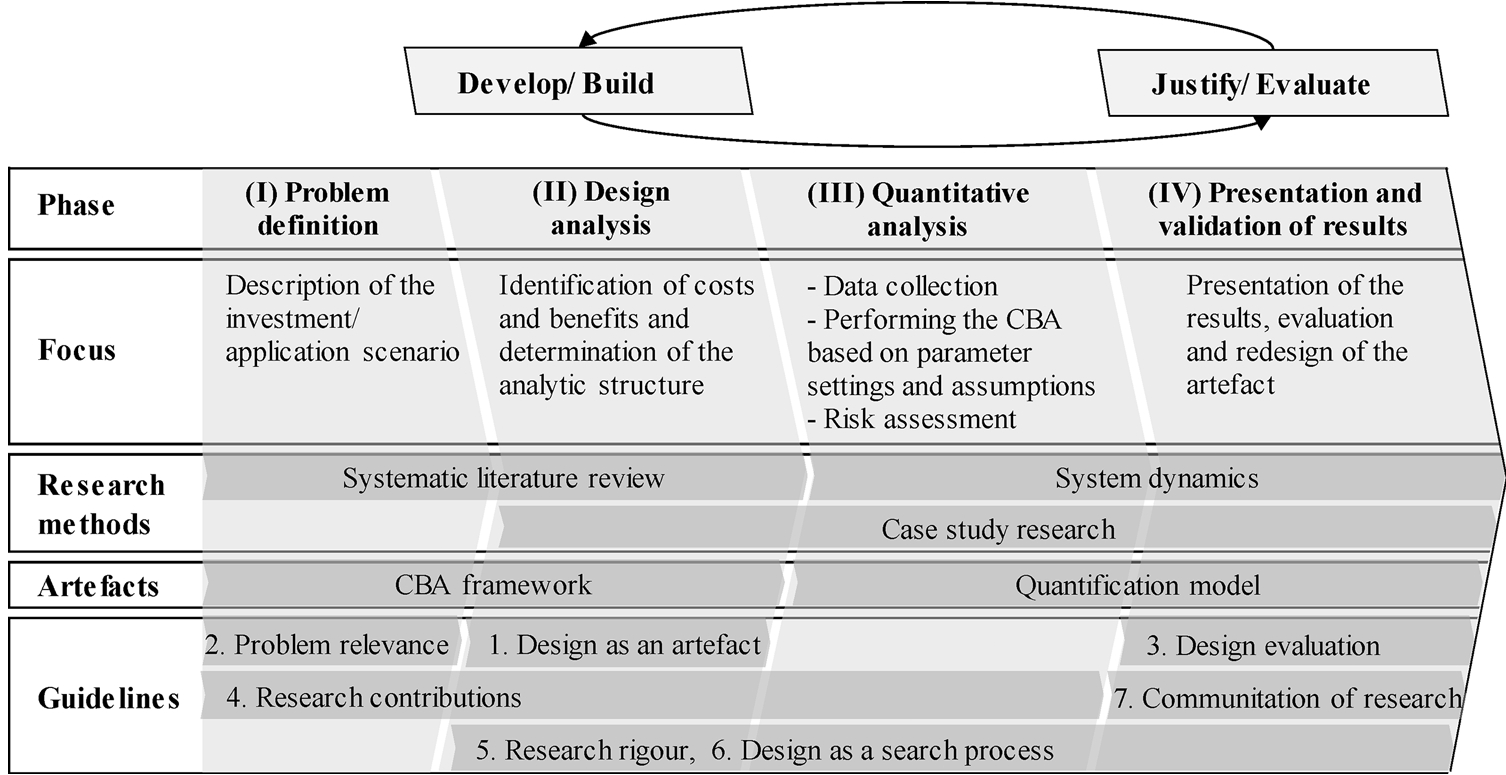 Figure 1: The Design Science Research (DSR) framework used to develop the quantification model.
Visualizing the Complexity: The Causal Loop
One of the paper's most significant contributions is the Causal Loop Diagram. It visualizes how "BIM Usage" cascades through the organization:
- Positive Reinforcement: Higher Quality Higher Customer Satisfaction More Contracts More Revenue.
- Internal Synergy: Improved Skills Fewer Injuries Better Working Conditions Lower Staff Turnover.
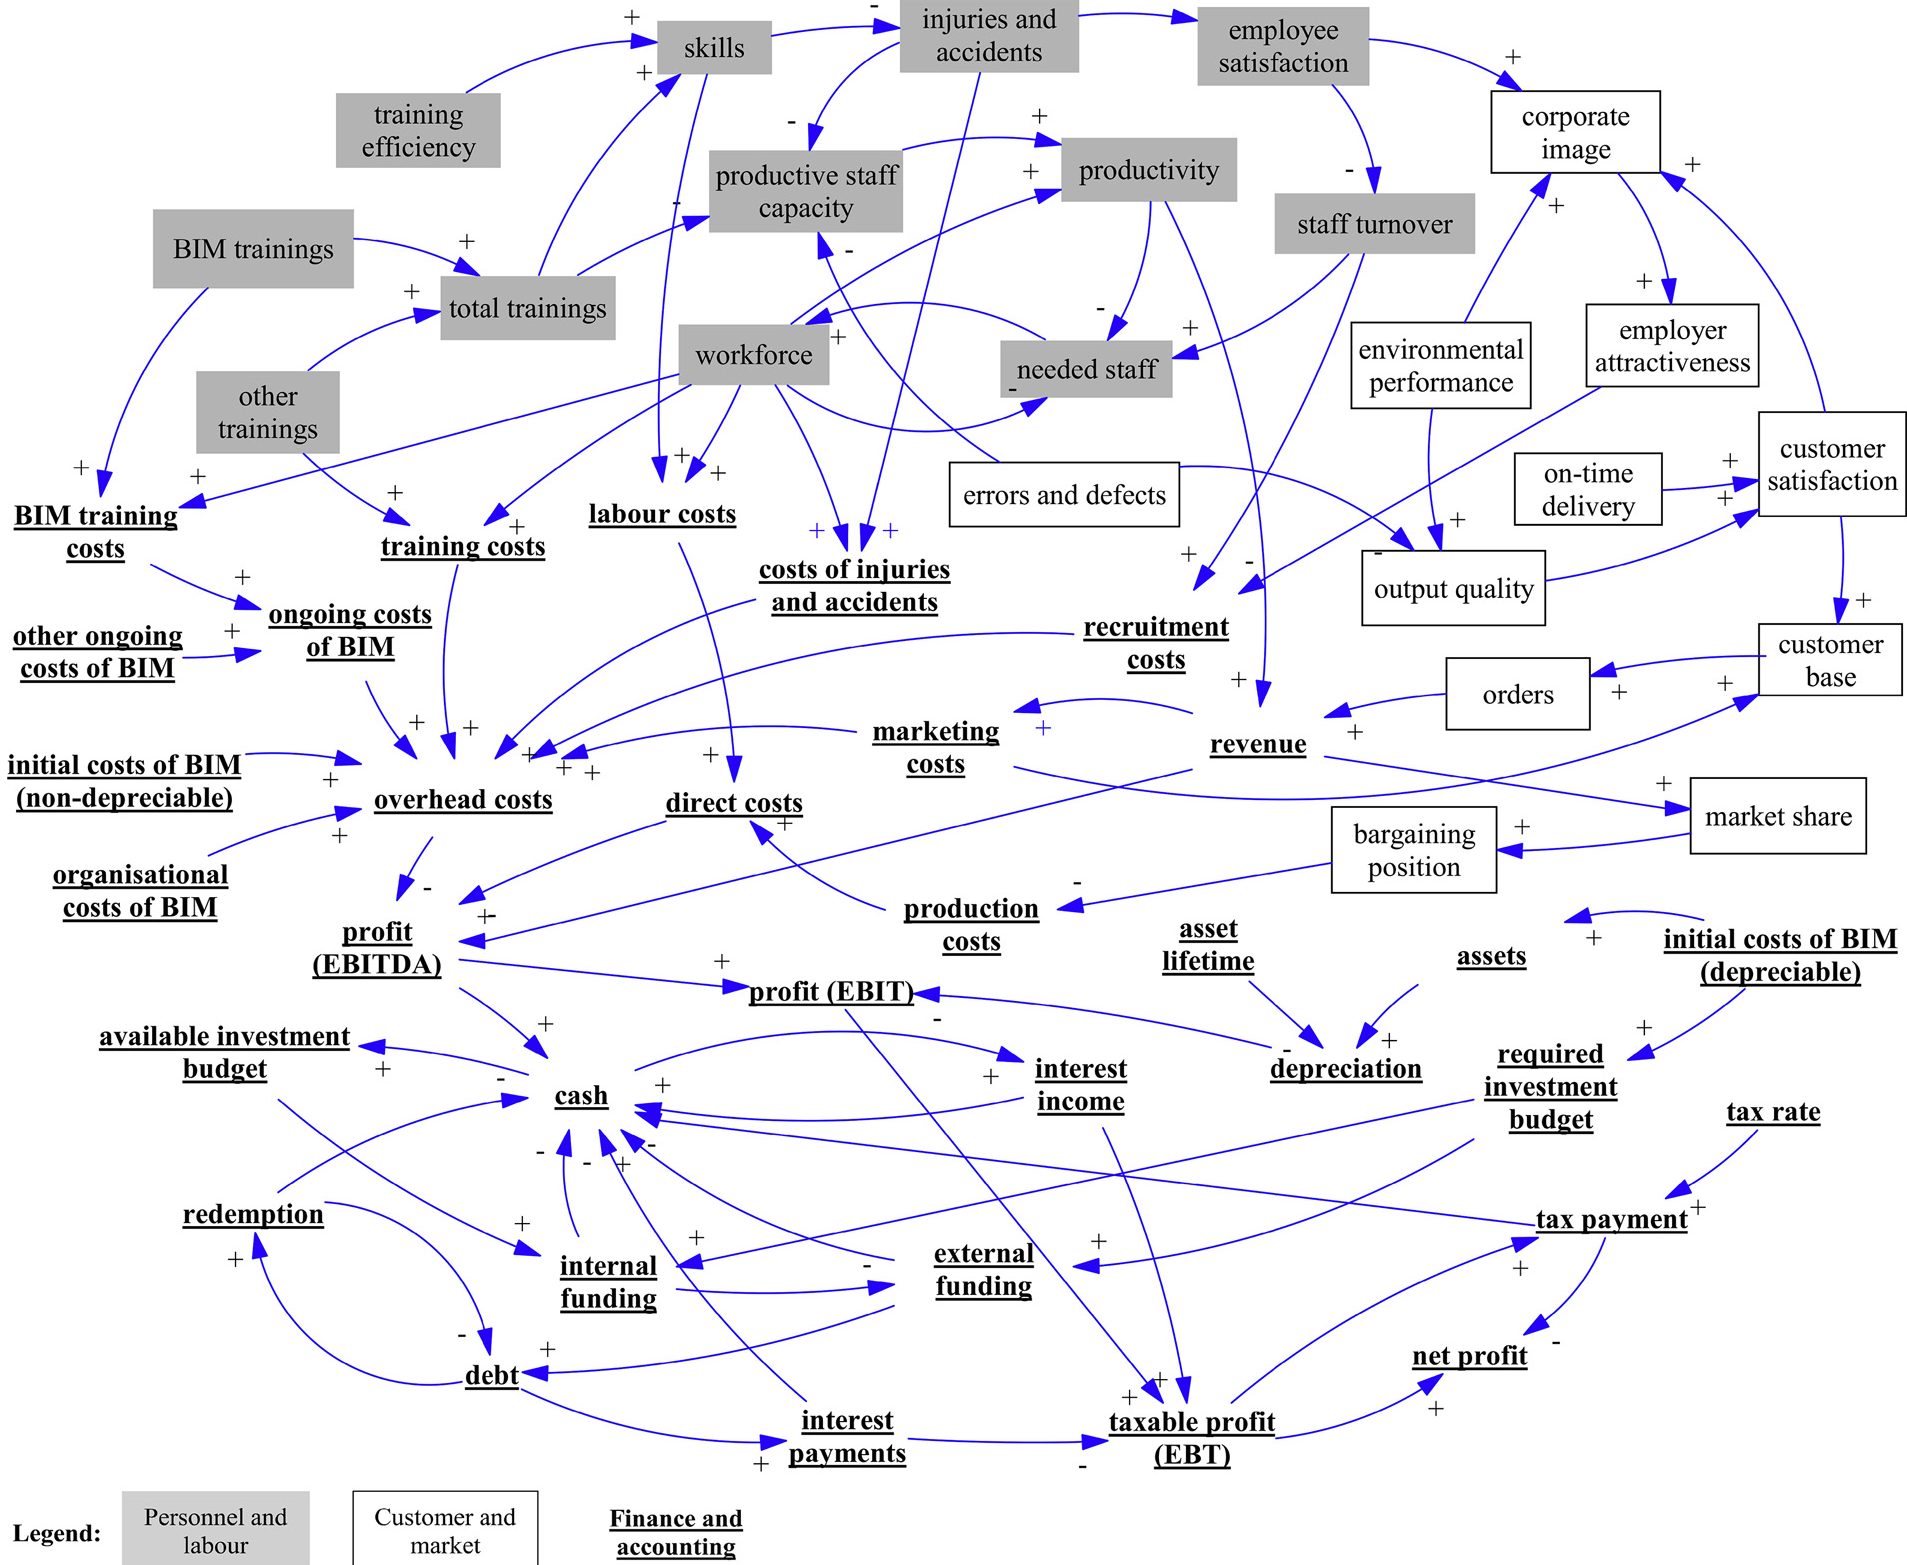 Figure 2: The complex web of feedback loops connecting BIM adoption to corporate performance.
Results: The Long Game
The simulation results for a mid-sized construction company (1,000 employees) are eye-opening.
- The Initial Dip: In Year 0 (), net profit drops significantly compared to the status quo due to "disruption costs" and high software/hardware outlays.
- The Breakthrough: By Year 1, the benefits of error reduction and improved delivery begin to outweigh costs.
- 20-Year Horizon: The Return on Revenue (ROR) stabilizes at 8%, compared to the stagnant 1.6% of firms that don't innovate.
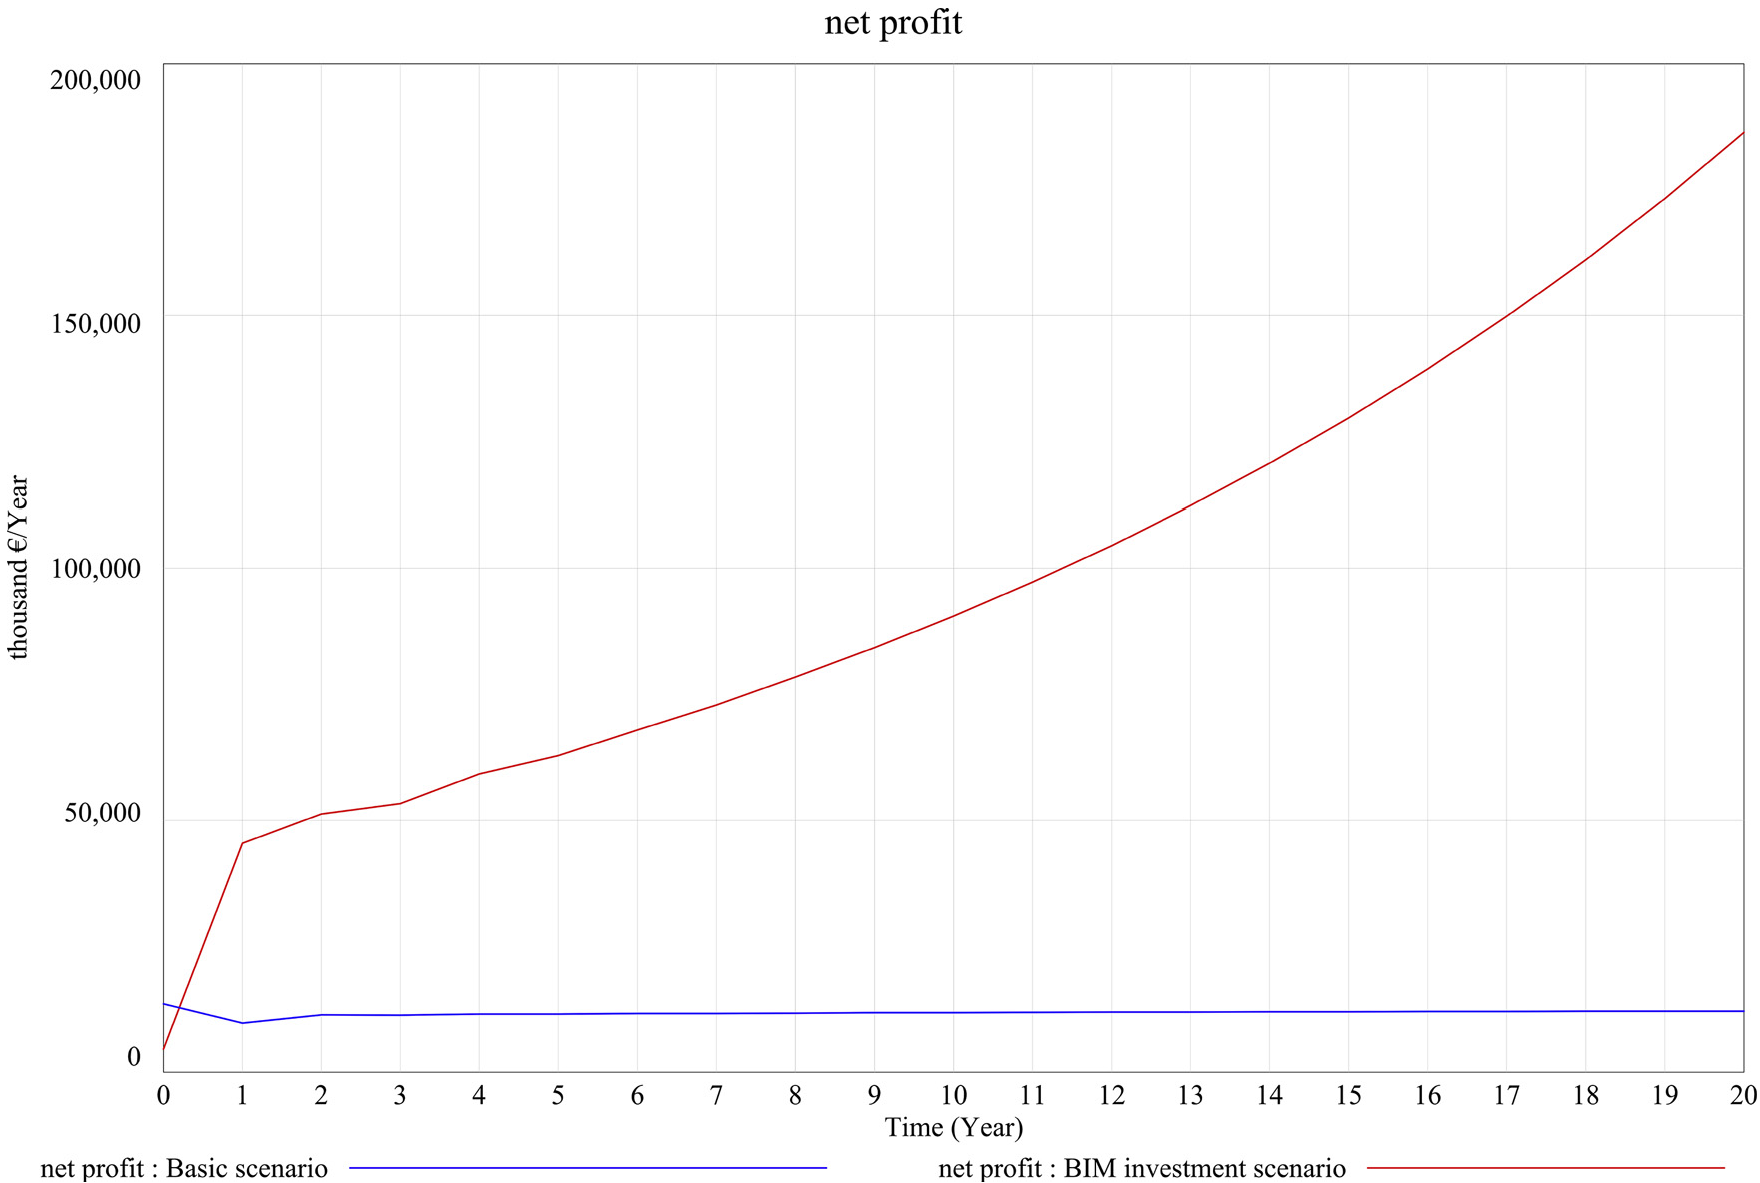 Figure 3: Comparative simulation showing the divergent paths of 'Basic Scenario' vs. 'BIM Investment Scenario'.
Managing Risk: The Monte Carlo Layer
Since future benefits are never certain, the authors ran 10,000 Monte Carlo simulations. Even in "less-than-ideal" scenarios where error reduction or delivery improvements weren't perfect, the BIM investment remained overwhelmingly positive. This adds a critical layer of "risk-aware" confidence for CEOs.
Critical Insight & Conclusion
The true value of this paper isn't just the 15x profit figure—it's the validation of "Soft" variables. By proving that employee satisfaction and corporate image have tangible financial endpoints, the authors provide a toolkit for AEC leaders to justify digital transformation.
Future Outlook: The paper warns of the "Rebound Effect"—where efficiency gains might be wasted if not managed properly. For BIM to work, the organization must not only adopt the tool but also commit to Benefits Realisation Management.
Takeaway: Stop asking "What does BIM cost?" and start asking "How does BIM change our system's behavior?"