
The Social Architecture of Code: How Team Networks Drive ISD Performance
Team structure and team performance in IS development: a social network perspective
This study utilizes Social Network Analysis (SNA) to investigate how team structures—specifically cohesion, conflict, and centrality—influence performance in Information Systems Development (ISD). Conducted across 25 development teams, it identifies group cohesion and domain knowledge centrality as primary predictors of superior project outcomes.
TL;DR
Is individual brilliance enough to guarantee the success of an Information System (IS) project? According to Yang and Tang, the answer lies not in individual skill alone, but in the social network structure of the team. By applying Social Network Analysis (SNA) to development teams, this study reveals that Group Cohesion and the presence of a Domain Knowledge "Star" are the true engines of high performance.
Beyond the Org Chart: Decoding the "Deep Structure"
Most project managers view teams through the lens of a formal hierarchy. However, this paper argues that the "internal, material structure" of a group is rarely visible on the surface. The authors shift the focus from what members do to how they relate, using three key metrics:
- Cohesion: The "glue" holding the team together (reciprocal positive relationships).
- Conflict: The presence of adversarial or "least-liked" pairings.
- Centrality: The extent to which a pivotal person exists to provide resources or guidance.
Methodology: Mapping the Invisible
The researchers tracked 25 ISD teams over a full semester, capturing data at the start-up, mid-term, and final implementation phases. They didn't just ask "who is the leader?"; they mapped four distinct networks:
- Advice: Peer-to-peer technical assistance.
- Leadership: Influence and conflict resolution.
- Obligation: Sense of responsibility and "showing up."
- Social: Emotional support and belonging.
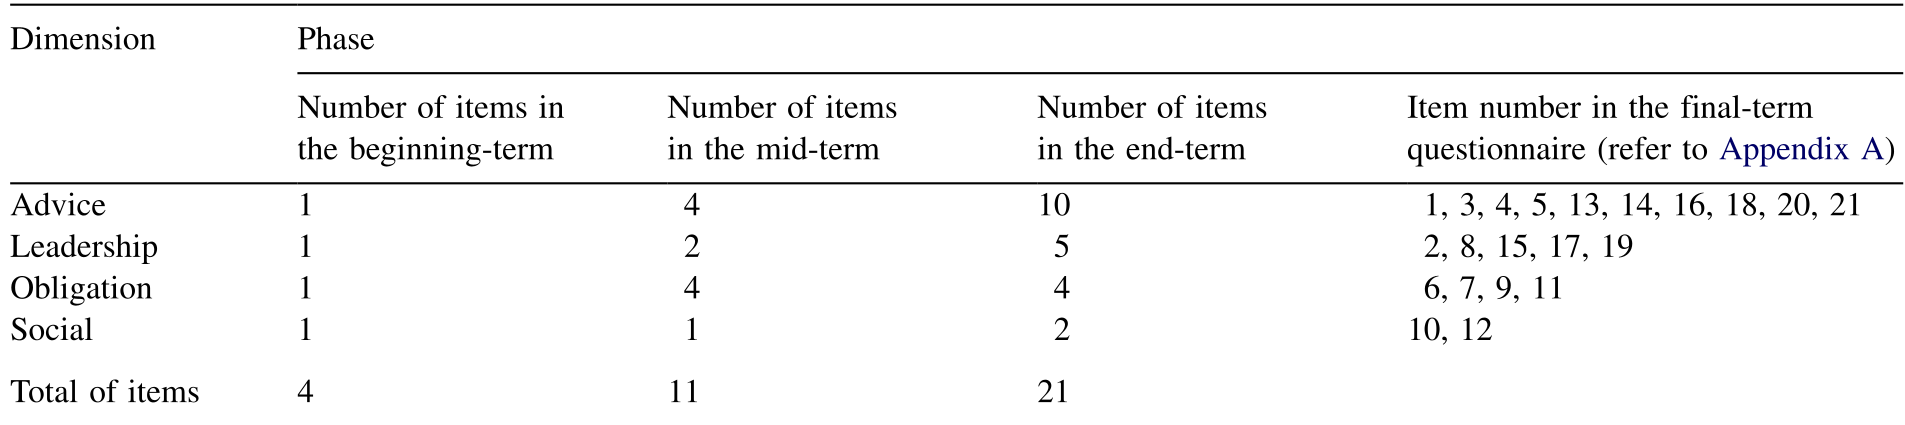 Table 1: The dimensions of teammate relationships measured via the TIQ questionnaire.
Key Insight 1: The "Domain Knowledge" Star
One of the most striking findings is that Domain Knowledge Centrality (understanding the organizational goals and the "live case" business logic) was a dominant factor for success. Teams with a clear "go-to" person for business requirements performed significantly better in System Analysis (SA) and System Design (SD).
This suggests that technical coding skill is secondary to the team's ability to anchor their code in real-world business needs. If a team lacks a central figure to interpret user requirements, the project lacks a "north star," leading to fragmented efforts.
Key Insight 2: Visualizing Failure through Sociograms
The study used sociograms to compare the best and worst teams. The results were visually stunning:
- High-Performing Teams: Displayed "positive pairs"—mutual respect between members that created a robust, cohesive core.
- Low-Performing Teams: Suffered from "isolates" (members who were socially or technically detached) and "imbalanced triangles."
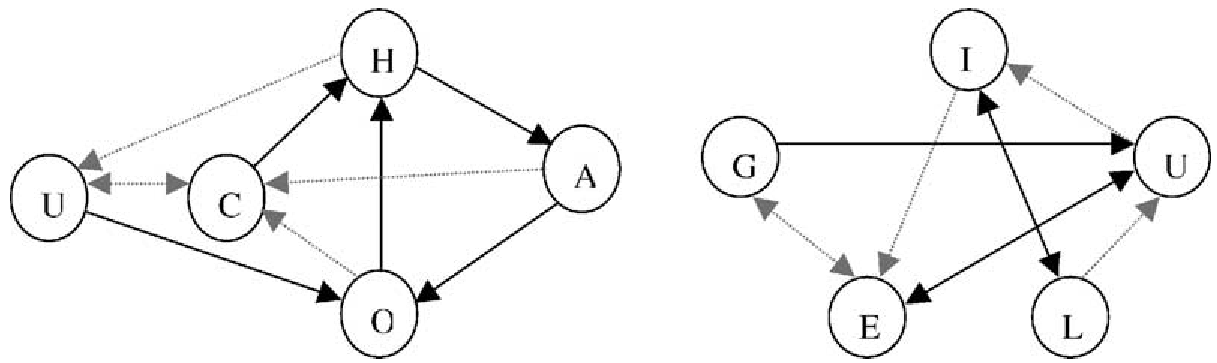 Figure 3: Sociogram comparison between the poorest (left) and best (right) performing teams. Dashed lines represent adversarial relationships; solid lines represent positive ones.
In the low-performing team (left), notice the "A-O-U" triangle. This imbalance often leads to a diffusion of responsibility. When player A thinks B is in charge, and B thinks C is in charge, critical tasks (like database design or documentation) fall through the cracks.
Clinical Analysis: Does Conflict Kill Projects?
Surprisingly, the research found that Conflict Indices were not strongly related to final performance, except in the case of "denial of responsibilities" (unwillingness to take unwanted jobs). This implies that a healthy team can survive interpersonal friction as long as their Advice Network Cohesion remains high. In other words, you don't have to be best friends to build great software, but you must be able to rely on each other for technical guidance.
Summary & Future Outlook
This paper serves as a vital reminder that ISD is a social process. The "soft" variables of network density and knowledge centrality have "hard" outcomes on software quality scores.
Takeaways for Managers:
- Identify the Knowledge Star: Ensure your team has a clear central point for domain expertise, especially during the Analysis phase.
- Monitor Cohesion Fluctuations: Cohesion tends to drop as the project gets harder (mid-to-late stages). Proactive team-building during the Implementation phase is crucial.
- Watch for Isolates: Use informal check-ins to ensure no team member has become a "social island," as this is a leading indicator of project failure.
While the study used university students (a limitation), the core logic—that social topology dictates technical efficiency—remains a foundational principle for any collaborative engineering effort.