
Beyond Static Links: Quantifying Speed and Reach in Time-Varying Social Networks
Characterising temporal distance and reachability in mobile and online social networks
This paper introduces a foundational framework for temporal distance and reachability in time-varying graphs. It proposes the "Average Temporal Path Length" and "Temporal Global Efficiency" metrics to quantify information diffusion speed, moving beyond static graph approximations to account for edge ordering and contact duration.
TL;DR
Most social network analysis treats connections as static "snapshots," but real-world interactions are fleeting and sequential. This paper introduces Temporal Distance Metrics, a mathematical framework that respects the arrow of time. By analyzing mobile traces and Facebook interactions, the authors prove that static graphs overestimate how "connected" we truly are, often ignoring the massive delays caused by the specific order in which we meet.
The "Static Graph" Trap
In classic network theory (like the "Small World" model), if A knows B and B knows C, information can flow from A to C. However, in the real world, if you meet B on Tuesday, but B met C on Monday, you cannot pass a physical message to C through B—the time order is wrong.
The authors argue that by aggregating interactions into a single static graph, researchers lose critical data on:
- Contact Duration: How long the "link" existed.
- Inter-contact Time: The "dark time" between meetings.
- Time Ordering: The sequence that dictates causality.
Methodology: The Temporal Graph Model
The paper represents a network as a sequence of graphs , where each "window" captures the state of the network at that moment.
Shortest Temporal Distance
The core metric is the shortest temporal path length (). Unlike traditional paths, a temporal path is a set of hops where each subsequent hop occurs at a time .
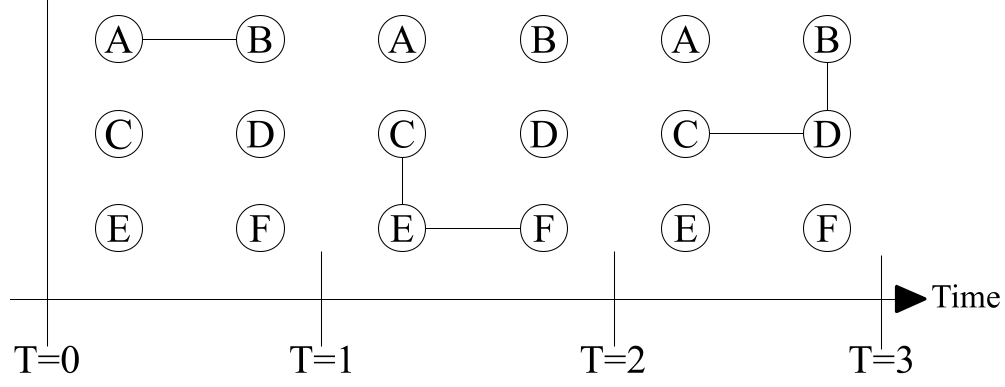 Figure 1: In this temporal graph, A can reach C only if the contacts occur in a specific order across windows 1, 2, and 3.
Temporal Efficiency ()
This captures how efficiently information spreads globally. If two nodes are "temporally disconnected" (no time-respecting path exists), their efficiency is 0. This is a much harsher, but more realistic, measure than static efficiency.
Key Insights from Real-World Data
The authors tested their metrics on three datasets: INFOCOM (conference Bluetooth hits), REALITY (MIT campus life), and FACEBOOK (online wall posts).
1. Static Graphs vs. Reality
The results were jarring. In the INFOCOM dataset:
- Static Metrics suggested a path length of ~1.3 hops with 0% disconnection.
- Temporal Metrics revealed that roughly 13% to 28% of node pairs could actually never reach each other, with "real" path lengths being significantly longer.
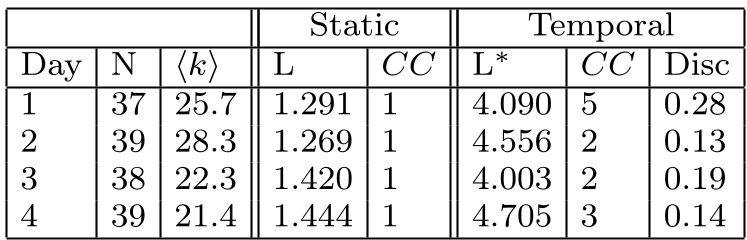 Table 4: Comparing Static vs. Temporal Metrics - Note the "Disc" column highlighting disconnected pairs.
2. The Cost of Being Human
A fascinating finding involves the "Reshuffled" model. When the authors randomized the order of meetings, the networks actually became more efficient.
- Why? Because human behavior is cyclic. We meet people during office hours and go home at night. This "burstiness" creates temporal bottlenecks.
- In the reshuffled (randomized) world, meetings are spread out, creating more "shortcuts" through time, which speeds up information diffusion.
Connected Components: Not Just Islands
In static graphs, you are either in a connected component or you aren't. In temporal graphs, Temporal Connected Components can overlap. Node C might be able to reach Node B, and Node B can reach Node A, but because of the time sequence, A might never be able to reach C. This asymmetry means that reachability is a "one-way street" in the temporal domain.
Critical Analysis & Future Outlook
Takeaway: This work transitions network science from a "spatial" focus to a "spatio-temporal" focus. It provides the mathematical tools to finally answer "How fast will this virus spread?" or "How quickly will this rumor reach the whole network?" with actual time units (hours/days) rather than abstract "hops."
Limitations: The metrics are highly sensitive to the Window Size (). If is too large, you fall back into the static graph trap; if too small, you might miss contacts during the scanning interval. Choosing the right "temporal granularity" remains an art form in this field.
Future Work: The logical next step is Temporal Centrality—identifying "superspreaders" who aren't just well-connected in space, but are active at the right times to bridge gaps in the network.