
TRACE: Solving the Fidelity-Performance Paradox in APT Detection
TRACE: Enterprise-Wide Provenance Tracking for Real-Time APT Detection
TRACE is a comprehensive, enterprise-wide provenance tracking system designed for real-time Advanced Persistent Threat (APT) detection. It combines unit-based selective instrumentation (UBSI) with distributed causality tracking to achieve an 80% detection rate of attack stages while significantly reducing overhead to 18% time and 10% space.
TL;DR
Modern Advanced Persistent Threats (APTs) are stealthy, often lurking in enterprise networks for months. TRACE is a scalable, real-time provenance tracking system that bridges the gap between low-fidelity audit logging and high-overhead taint tracking. By partitioning process execution into "units," it eliminates the dreaded "dependence explosion" problem, providing clear forensic paths for over 80% of attack stages with minimal runtime overhead.
The Core Conflict: Accuracy vs. Scalability
In the world of system forensics, we usually have two choices, both flawed:
- Audit Logging: Fast, but treats a process as a single "black box." If a browser stays open for a month, every file it ever touched is technically "causally linked" to every network packet it received. This is the Dependence Explosion.
- Instruction-level Taint Tracking: Hyper-accurate, but slows the system to a crawl (often 10x slower), making it unusable for real-world production servers.
TRACE introduces a "Unit-based" middle ground. It recognizes that most long-running programs (like browsers or servers) are just one big loop. By treating each loop iteration as an independent Execution Unit, we can say: "This network packet only influenced this file write," cutting through the noise.
Methodology: How TRACE Operates
The system's architecture is divided into host-level tracking and enterprise-wide integration.
1. Unit-Based Selective Instrumentation (UBSI)
Instead of tracking every instruction, TRACE uses static analysis to identify "unit-inducing loops." It then instruments these loops to mark boundaries.
- The Innovation: It identifies shared data structures to track dependencies between units (e.g., a task queue connecting a producer thread to a consumer thread).
- Evolution Highlights: Over four years, the team moved dependency identification "upstream" into the instrumentation itself, reducing Inter-Process Communication (IPC) overhead.
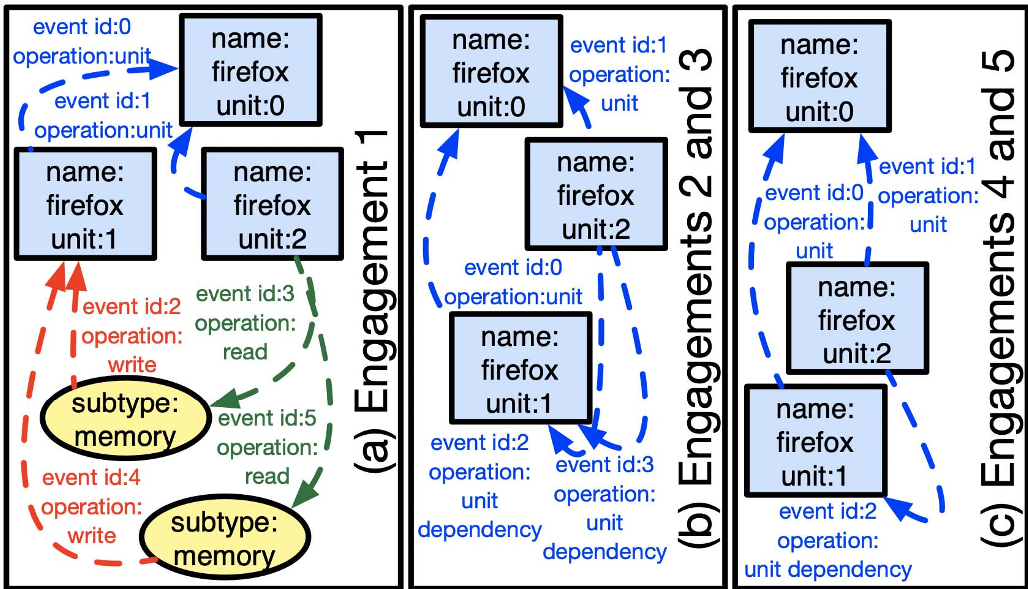 Fig 1: TRACE Overview - Integrating UBSI (Host-level) with SPADE (Enterprise-level).
2. Distributed Causality
TRACE doesn't just look at one computer. It uses a modified SPADE engine to build a global graph. It solves a classic problem: how do you know a socket on Host A is the same connection as the socket on Host B? TRACE creates a unique "Network Artifact" by combining timestamps, IP addresses, and ports, allowing subgraphs from across the company to snap together like LEGO bricks.
Experimental Validation: The Red-Team Engagements
The paper stands out by reporting on 5 real-world "Adversarial Engagements." Independent red teams launched attacks (like Bovia and Drakon) while analysis teams used TRACE data to find them.
| Engagement | Key Improvements | Runtime Overhead |
|---|---|---|
| Eng 1 | Initial 47 Syscalls tracked | High (450%+) |
| Eng 3 | Added kernel modules for UDP/IPC | ~60% |
| Eng 5 | Full self-protection & upstream UBSI | 18% |
Case Study: The Bovia Attack
In the Bovia attack, a compromised Firefox process was used to download a malicious dropper. Traditional logs would have linked the dropper to every tab the user had open. TRACE pinpointed the exact execution unit (the specific tab/loop iteration) that handled the malicious site, providing a clean causal chain from "Inbound Connection" to "Data Exfiltration."
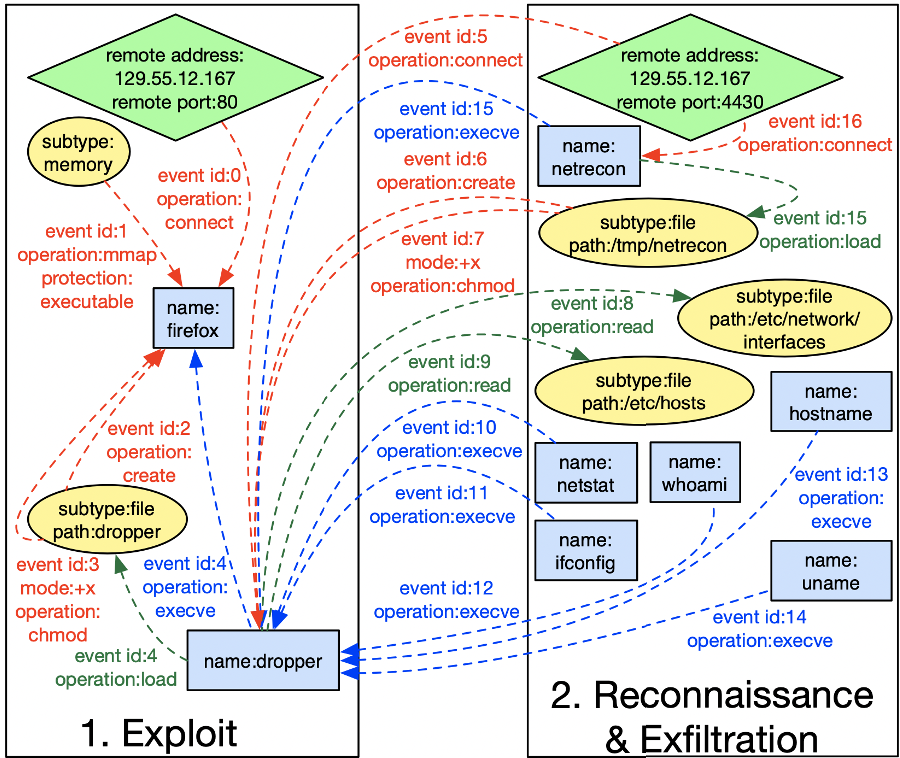 Fig 2: Forensic Graph of the Bovia Attack - Note the clear transition from Exploit to Reconnaissance.
Critical Analysis & Insights
- The "ptrace" Lesson: Early versions missed code injection attacks because they didn't track the
ptracesyscall. This highlights a fundamental truth in security: Visibility is everything. You cannot detect what you do not measure. - Self-Protection: By Engagement 4, attackers realized TRACE was their biggest enemy and started killing the TRACE process. The authors responded by implementing a kernel-level self-protection feature—a must-have for any modern EDR (Endpoint Detection and Response) system.
- Efficiency: The leap from 452% overhead to 18% is staggering. It proves that most of the "cost" of security isn't the data itself, but the inefficient handling of that data (redundant logs, slow serialization).
Conclusion
TRACE proves that high-fidelity provenance is not just a theoretical tool for forensic researchers, but a practical shield for enterprise networks. By focusing on the "Unit" of execution, it provides the "How" and "Why" of an attack, not just the "What."
Future Outlook: The next frontier is moving the log filtering into the kernel itself (e.g., via eBPF) to further drop that 18% overhead toward zero, making provenance tracking a default, invisible feature of every operating system.