
Deciphering Digital Fingerprints: Tracing Images to Social Networks via CNNs
Tracing images back to their social network of origin: A CNN-based approach
This paper introduces a CNN-based forensic method to identify the social network of origin (e.g., Facebook, WhatsApp, Twitter) for digital images by analyzing distinctive artifacts left by platform-specific processing. The approach achieves state-of-the-art results across seven popular platforms and a standalone camera class using only frequency-domain visual features.
TL;DR
In a world where images are constantly re-shared, cropped, and compressed, identifying an image's most recent source is a forensic challenge. This paper presents a CNN-based approach that ignores metadata and looks solely at the frequency domain of an image patch. By learning the "invisible" fingerprints left by social media processing (like Facebook's specific JPEG quantization), the model can identify with ~95% accuracy whether an image came from WhatsApp, Telegram, or Facebook.
Problem & Motivation: The Metadata Mirage
In criminal investigations, knowing if an image was captured locally or downloaded from a specific chat app is a critical lead. However, investigators face two major hurdles:
- Metadata Stripping: Social networks usually wipe EXIF data to protect user privacy and reduce file size.
- Platform Variability: Every platform uses its own proprietary pipeline of resizing, filtering, and JPEG compression.
Previous methods tried to model these as simple K-NN problems or decision trees, but they lacked the robustness to handle "wild" images of various resolutions. The authors' insight was to move away from the spatial domain (pixels) and look at the frequency domain (DCT), where the mathematical scars of compression are most visible.
Methodology: Mining the Frequency Domain
The core of the method is a hybrid of classical signal processing and modern deep learning.
1. Robust Feature Extraction
Instead of feeding raw pixels into a CNN—which might cause the network to accidentally learn content (e.g., "beaches are usually from Instagram")—the authors use DCT-based features:
- The image is split into patches.
- For each patch, DCT coefficients are extracted.
- Histograms of these coefficients (the first 9 spatial frequencies) are built to represent the statistical distribution of quantization artifacts.
2. CNN Architecture
The resulting 909-element vector (101 histogram bins 9 frequencies) is passed into a 1D CNN.
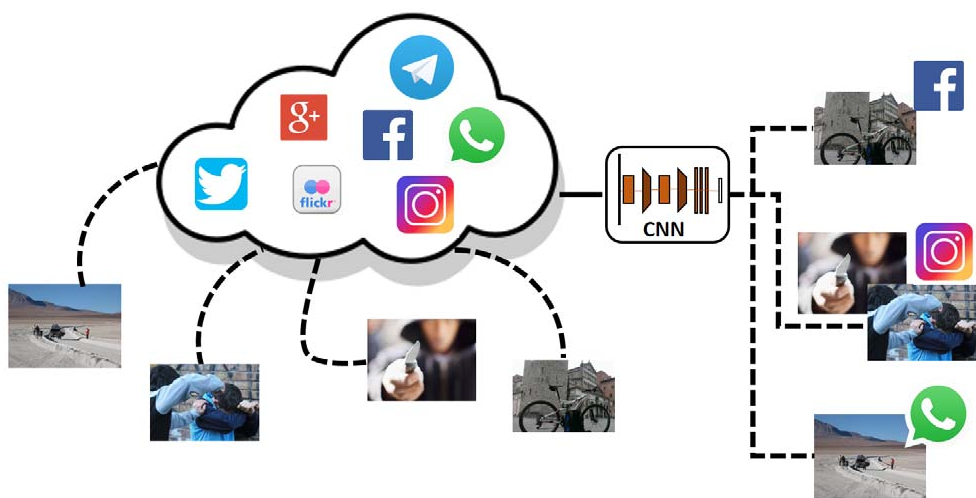 Fig 1: High-level overview of the ingestion of images into the frequency-aware CNN for provenance classification.
The architecture uses:
- Convolutional Blocks: 1D convolutions with ReLU activations to extract local patterns in the histogram distributions.
- Max-Pooling: To reduce dimensionality.
- Fully Connected Layers: 256 neurons each, utilizing Dropout to prevent overfitting on specific platform datasets.
 Fig 2: The 1D CNN structure designed to process histogram vectors rather than spatial grids.
Experiments & Results: Beating the Baseline
The authors tested the system on three datasets, including "wild" images (Public Social) and a multi-class dataset (Iplab) featuring 8 origins: Facebook, Flickr, Google+, Instagram, Telegram, Twitter, WhatsApp, and the Original camera capture.
Key Performance metrics:
- Accuracy: The model achieved an average of 95% accuracy at the image level (using majority voting across patches).
- Generalization: Even on uncontrolled datasets, it maintained high performance, whereas previous SOTA methods (Caldelli et al., 2017) saw significant drops (from 88% down to lower levels).
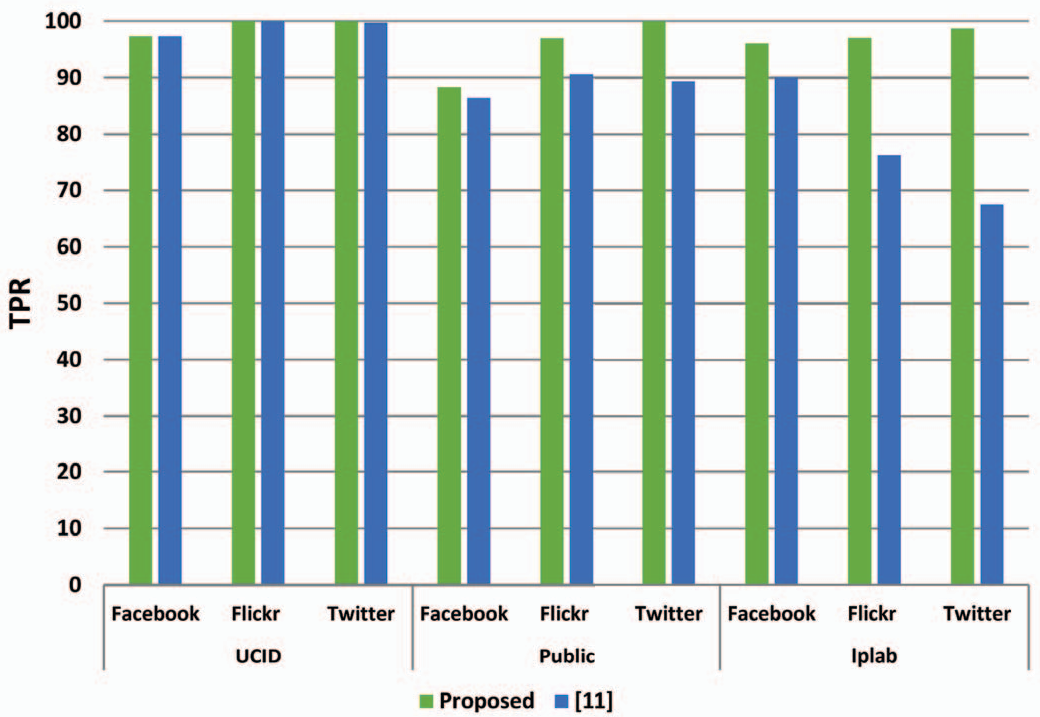 Fig 3: Comparison in True Positive Rate (TPR). The proposed CNN method (green) consistently outperforms the previous pixel-based approach (blue).
Interesting Observation:
The network found Google+ images difficult to distinguish from "Original" photos, suggesting that Google+ performed less intrusive resizing/compression than heavy-handed platforms like WhatsApp or Facebook.
Critical Analysis & Conclusion
The paper successfully demonstrates that deep learning can "reverse-engineer" the effects of social network image processing pipelines.
Takeaways:
- Frequency Wins: Using histograms of DCT coefficients is a brilliant way to normalize for image content and focus strictly on processing signatures.
- Scalability: The system works with 8 classes, making it useful for real-world forensic toolkits.
Limitations: The primary challenge remains multiple uploads (e.g., an image sent via WhatsApp and then uploaded to Facebook). Preliminary tests showed the model identifies the last platform in the chain, but "chain of custody" forensics for images remains an open, complex research area.
Future Outlook: As social networks update their algorithms, these models must be continuously retrained. The next step for this research is likely the application of Transfer Learning to adapt to new platform updates without needing to rebuild datasets from scratch.