
SMAI: Utilizing the "Social Sensor" to Track UK Drinking Habits in Real-Time
Towards tracking and analysing regional alcohol consumption patterns in the UK through the use of social media
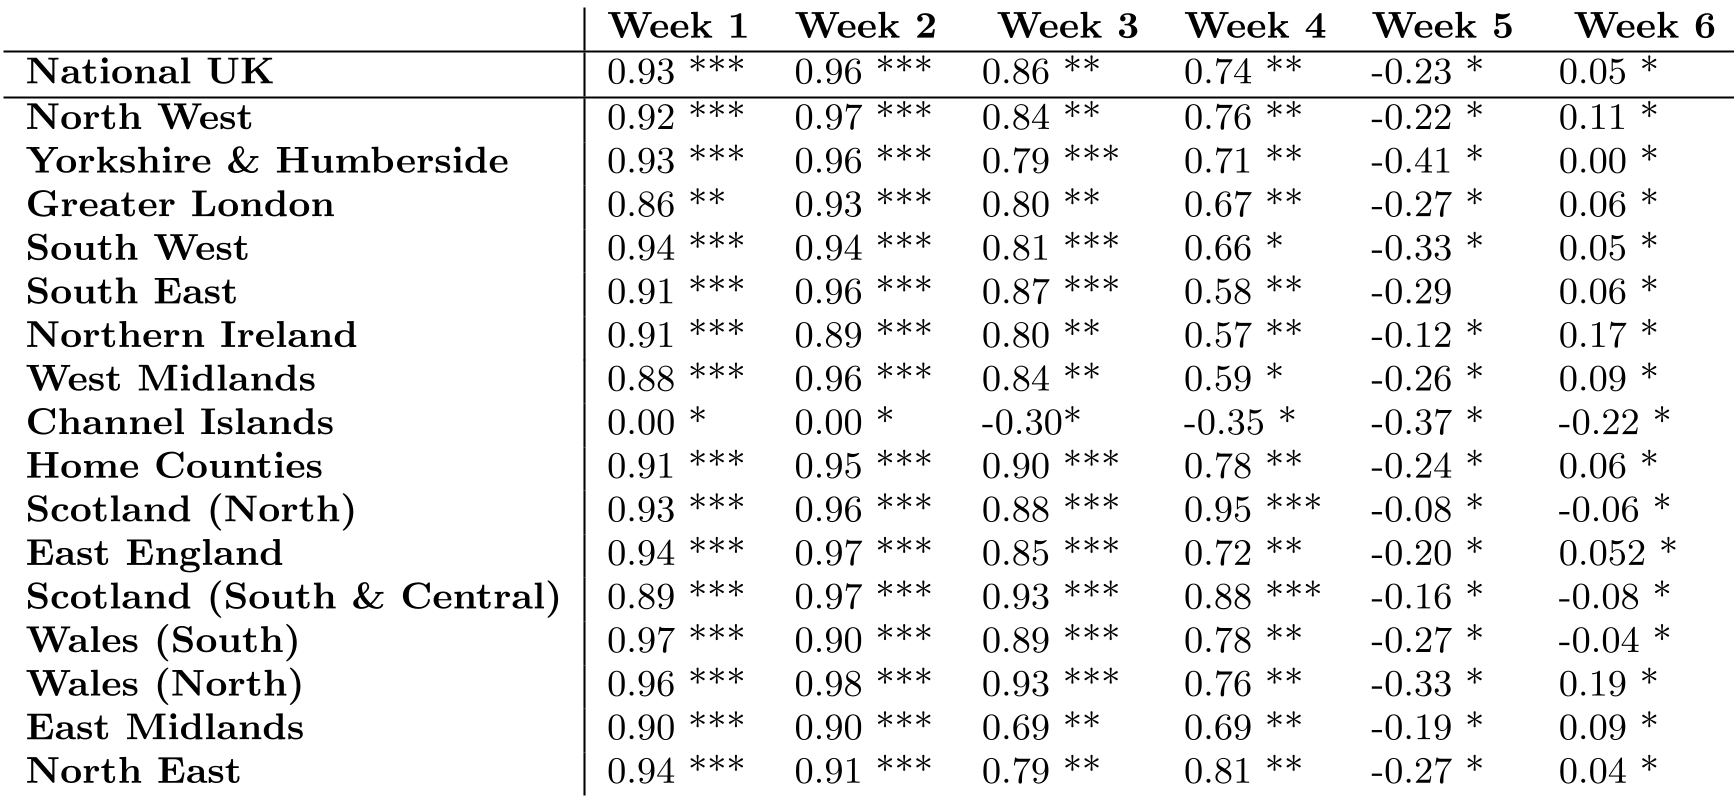
The paper introduces the Social Media Alcohol Index (SMAI), a novel framework for tracking regional alcohol consumption patterns in the UK using geotagged Twitter data. By analyzing 31.6 million tweets, the authors achieved high correlations (up to 0.97) with official national health statistics, demonstrating the viability of social media as a real-time proxy for public health monitoring.
TL;DR
Researchers from Lancaster University have developed the Social Media Alcohol Index (SMAI), a tool that turns Twitter into a giant, real-time sensor for alcohol consumption. By analyzing millions of geotagged tweets, the system can mirror official health data with up to 97% accuracy, capturing the fine-grained ebbs and flows of British drinking habits that traditional surveys miss.
Context: The Lag in Traditional Surveillance
In the UK, alcohol consumption is a significant public health burden, yet our data is chronically out of date. Current statistics from the Health & Social Care Information Centre (HSCIC) rely on self-reported surveys that are often published months after the fact. These methods suffer from recall bias (people forget what they drank) and social desirability bias (people lie about how much they drank).
The author's insight: People might lie to a doctor about their 10th pint, but they are surprisingly honest (and frequent) in reporting their drinking status on social media.
Methodology: Building the SMAI
The researchers processed 31.6 million tweets over a six-week period covering the festive season. The methodology involves a multi-step pipeline:
- Filtering: Identifying tweets containing "markers" indicative of alcohol use (Drunk, Wasted, Wine, Hangover, etc.).
- Spatio-Temporal Mapping: Using a kd-tree data structure to map tweets to specific UK postcodes and timestamping them to track changes by the hour.
- Indexing: Calculating the SMAI score as the ratio of alcohol-related tokens to total tokens in a given region/timeframe.

The heavy lifting was performed via Hadoop/MapReduce, allowing the team to scale the analysis across 252.8 million processed instances (accounting for different geographical overlaps).
Key Findings: The Pulse of the Nation
The study’s results validate the "Social Sensor" theory. During the first weeks of the study, the SMAI perfectly tracked regional trends.
The "Festive Spike"
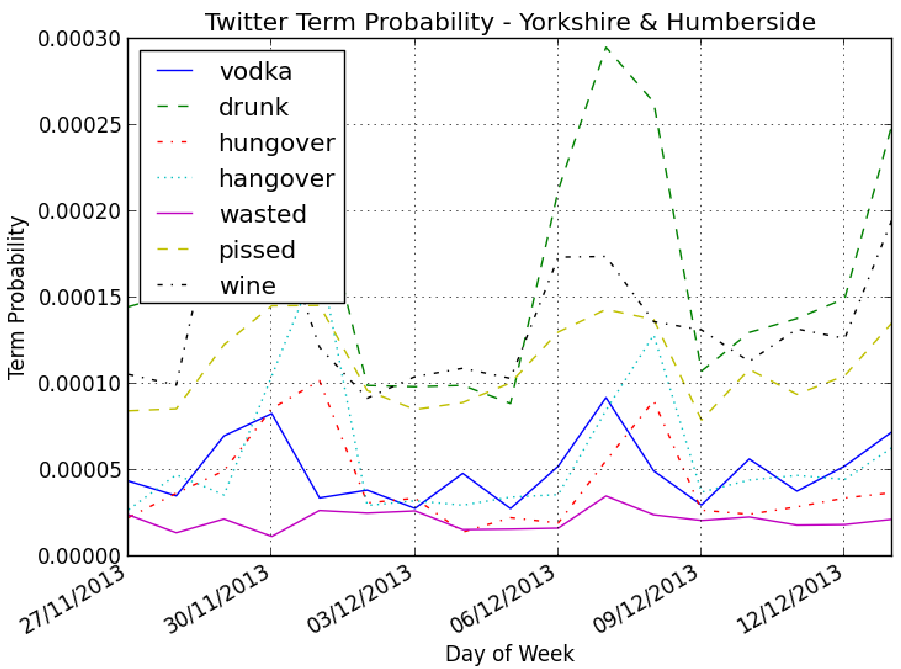
Perhaps the most striking visualization is the consumption pattern during Christmas and New Year. The data showed a distinct increase leading up to Christmas Day, a brief "plateau" (likely due to people staying off work), and a massive surge for New Year’s Eve.
Linguistic Regionalism
The study also performed a Qualitative Analysis through word clouds and collocations. They discovered:
- "Hungover" mentions spiked 12-24 hours after "Drunk" mentions, providing a logical temporal validation.
- Regional Slang: Greater London users were significantly more likely to use the term "pissed" compared to other regions, particularly during mid-week student nights.
- Drink Preferences: "Wine" (specifically Red) was the most discussed alcohol type around the Christmas holidays.
Critical Insight & Limitations
While SMAI is a powerful proxy, it is not without its Inductive Biases. The authors acknowledge a population bias: Twitter's demographic skewing toward younger adults means the index might over-represent youth culture and under-represent the drinking habits of older generations who don't tweet their "hangovers."
Furthermore, the "rich-get-richer" phenomenon in language—where certain hashtags or terms become trendy regardless of the underlying behavior—could potentially skew results during viral events.
Conclusion
This work marks a shift toward "Digital Epidemiology." By leveraging the pervasive and unobtrusive nature of micro-blogging, public services like A&E departments and police can move from reactive staffing based on "last year's report" to proactive staffing based on "last night's data."
For future work, adding sentiment analysis and expanding the marker set to filter out commercial "spam" (e.g., ads for wine) would further sharpen the SMAI's accuracy.