
The Triad Puzzle: Why Your Social World is Mathematically Constrained
A puzzle concerning triads in social networks: Graph constraints and the triad census
The paper investigates the "triad census" in social networks—the distribution of 16 possible configurations for triples of actors. By analyzing 159 diverse social networks, the author demonstrates that approximately 85-90% of the variability in triad distributions can be explained by lower-order graph features, specifically the "dyad census" (counts of mutual, asymmetric, and null pairs).
TL;DR
Why do social networks look the way they do? Katherine Faust's seminal work explores a nagging paradox: triadic structures (like "a friend of a friend is a friend") are the bedrock of sociology, yet they are mathematically almost inevitable once you know the basic density of ties. By analyzing 159 networks—from ants to humans—Faust reveals that while our social choices are meaningful, they operate within a remarkably narrow "graph theoretic" cage.
The Paradox of the Triple
In social network analysis (SNA), the triad—a group of three actors—is the smallest unit where complex social dynamics like mediation, betrayal, or "forbidden" relationships emerge. For decades, researchers focused on transitivity (triadic closure) as the primary driver of network evolution.
However, a "puzzle" emerged: previous studies suggested that if you simply knew how many mutual, asymmetric, and null pairs (dyads) existed in a network, you could predict the distribution of triads with ~90% accuracy. If the "lower-order" features (dyads) explain the "higher-order" features (triads), are triads actually socially interesting, or just mathematical leftovers?
Methodology: Mapping the Manifold of Possibility
To solve this, Faust utilized a massive dataset of 159 networks spanning species (monkeys, dolphins, humans, even ants) and relation types (grooming, fighting, friendship).
1. The Triad Census
Every triple of actors must fall into one of 16 isomorphism classes (see the standard Holland and Leinhardt labels like 003, 030T, or 300).
2. The Null Model
The crux of the method is comparing observed networks to a "Conditional Uniform Graph." Specifically, if we take a network and randomly reshuffle its ties while keeping the exact number of Mutual, Asymmetric, and Null dyads constant, what would the resulting triad distribution look like?
3. Visualizing Constraints via SVD
Faust applied Singular Value Decomposition (SVD) to create a theoretical "skeleton" of triad expectations.
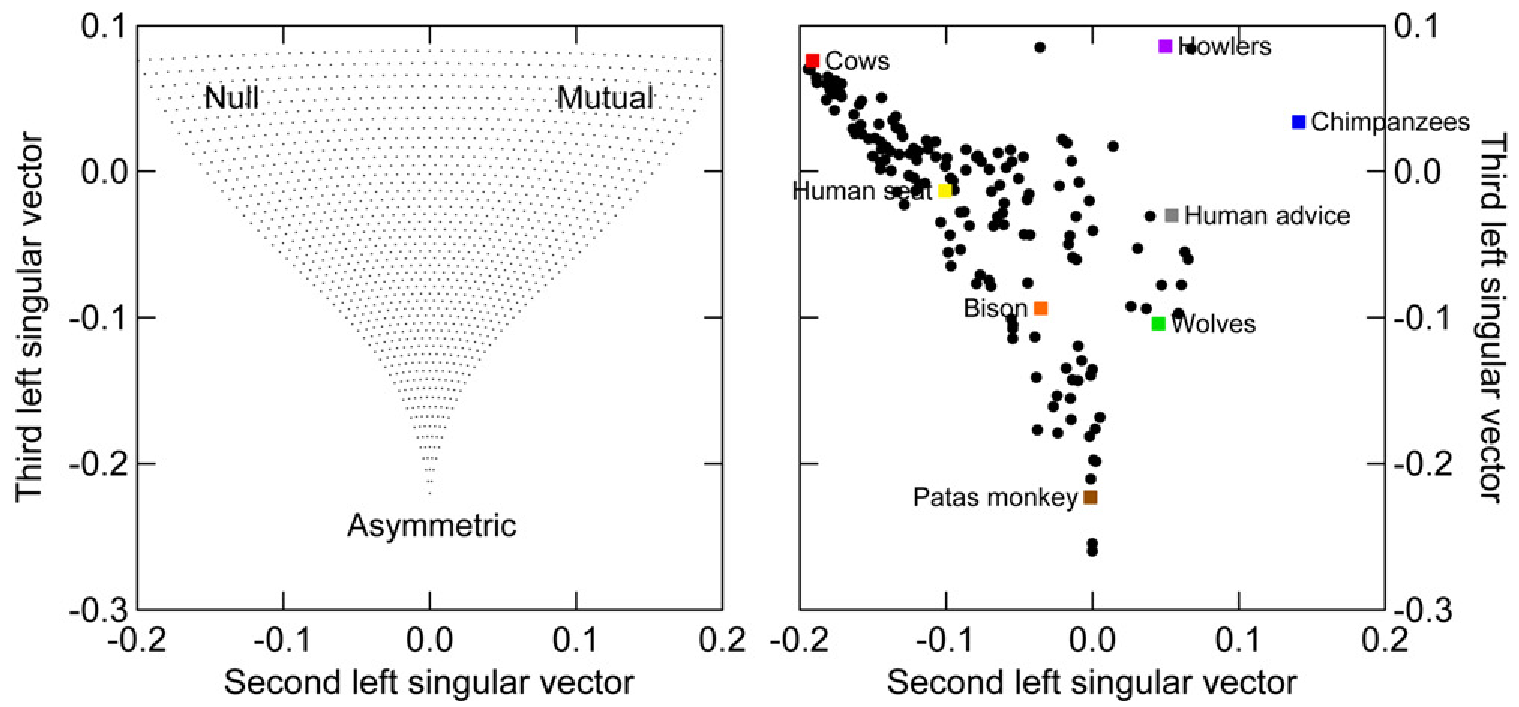 Figure 1: The theoretical space for triad expectations. The triangular manifold shows how dyadic properties (asymmetry vs. mutuality) anchor the possible shapes a network can take.
Key Insights: Latitude Within Limits
The results provide a nuanced answer to the puzzle.
Resemblance is High: The dyad census indeed accounts for about 85% of the variance in triad distributions. In Figure 2 below, you can see how observed points (filled circles) closely follow the dashed lines of mathematical expectation.
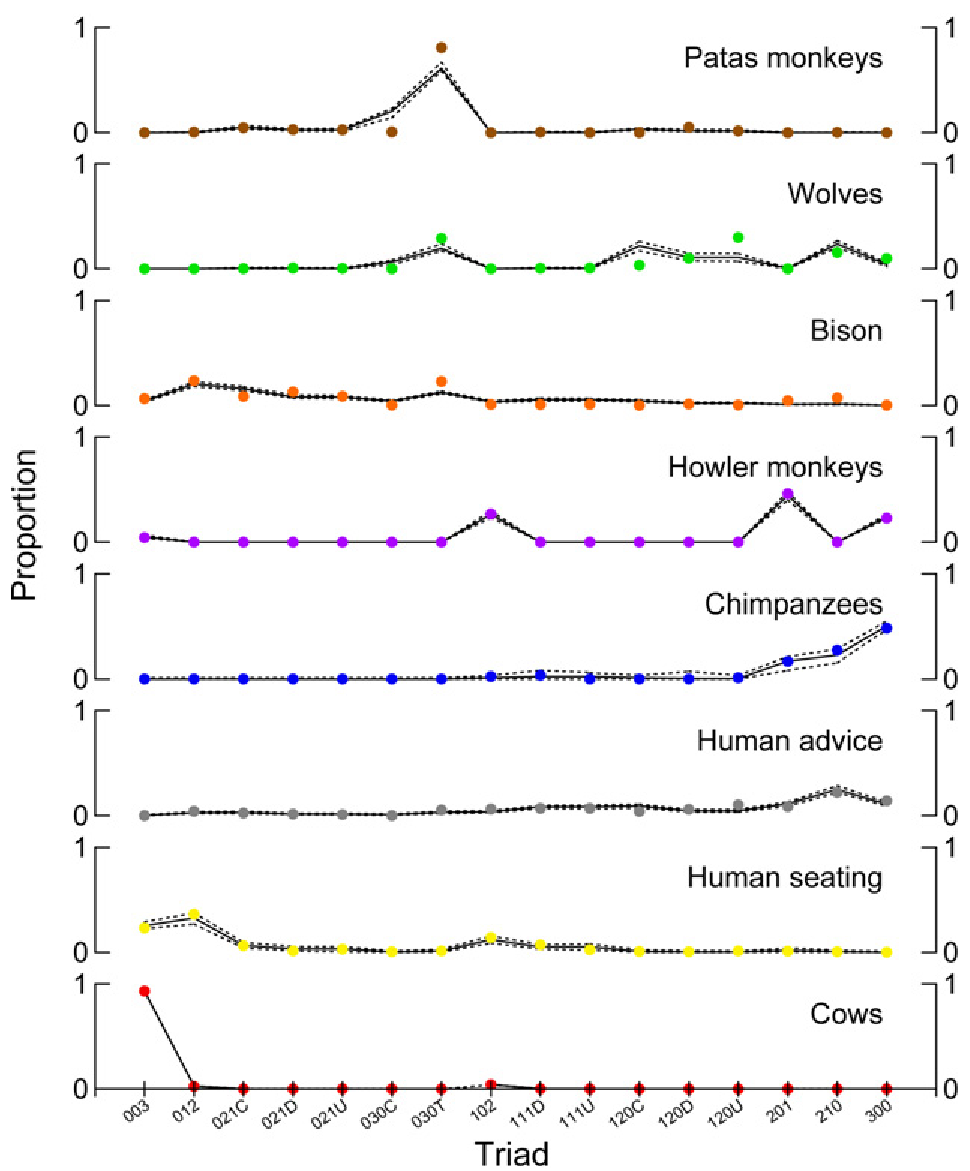 Figure 2: Triad proportions for example networks. Note how the empirical points track the narrow bands allowed by the dyad census.
But Departures are Significant: Paradoxically, even though the error margin is small (the remaining 10-15%), a staggering 84% of the networks studied showed significant triadic patterning.
The "Between" vs. "Within" Effect
Faust’s core insight is a lesson in variance:
- Between-Network Variance: Differences in triad distributions across different networks (e.g., a "fight" network vs. a "friendship" network) are almost entirely explained by their dyadic properties (density and reciprocity).
- Within-Network Variance: Within a single network, the "choice" to arrange those dyads into transitive triads or structural holes is where the social "magic" happens. The graph constraints force triads into a narrow range, but social agents consistently "nudge" the network toward specific corners of that range.
Critical Analysis & Conclusion
The Rarity of Density
One of Faust's most interesting incidental findings is the "unoccupied" region of the triad space. Very few empirical networks are dense enough to be dominated by the "300" triad (all mutual). This suggests a fundamental limit—perhaps cognitive or temporal—on how many mutual ties individuals can maintain.
Industry and Research Takeaways
- For Data Scientists: When building graph neural networks (GNNs) or link prediction models, remember that a model that perfectly captures dyadic statistics will already look "90% correct" on triad distributions. The true test of a "socially aware" model is its ability to capture that final, stubborn 10% of triadic departure.
- Limitations: This study is structural and static. It doesn't tell us how actors move through time to reach these constrained states.
In summary: Geography is destiny, but you still choose where to walk. In social networks, the dyad census is the geography—the triad census is the path we choose within it.