
Two 1%s Don’t Make a Whole: The Illusion of Multi-Connection Sampling on Twitter
Two 1%s Don’t Make a Whole: Comparing Simultaneous Samples from Twitter’s Streaming API
This paper investigates the consistency and potential bias of Twitter's Streaming API by comparing five simultaneous connections tracking identical keywords. The study reveals that over 96% of tweets are identical across all samples, contradicting the expected behavior of independent uniform sampling and proving that multiple connections cannot be used to bypass rate limits.
TL;DR
If you've ever thought about "gaming" Twitter’s 1% data limit by opening multiple API connections simultaneously, this paper has a clear answer: Don't bother. By comparing five simultaneous streams, the authors found a staggering 96% overlap in data. This suggests that Twitter doesn't give every user a random slice of the pie; instead, it gives everyone almost the exact same slice.
The "Sample Bias" Anxiety
In the world of computational social science, the Twitter Streaming API is the bread and butter of data collection. However, it operates as a "black box." We know we are getting a fraction of the total "Firehose" (the full stream), but we don't know which fraction.
The central tension is twofold:
- Representativeness: Is the 1% we see a fair reflection of the 100%?
- Collectability: Can we aggregate multiple 1% samples to get 5%, 10%, or more?
The authors provide a rigorous empirical test to see if these samples are independent draws or a redundant broadcast.
Methodology: Five Eyes on the Stream
The research team at CMU set up five unique accounts tracking the same high-volume keywords (like "the", "i", "be") at the exact same time. They even experimented with staggering connection start times and adding "noise" keywords to see if the sampling algorithm could be perturbed.

Deep Dive: Why It's Not Random
The most striking part of this study is the comparison between Empirical Data and Probability Theory.
If Twitter were sampling randomly, the probability of a tweet appearing in multiple streams should follow a Binomial Distribution. Under random sampling, it would be highly unlikely for the same tweet to appear in all five connections. However, the results (shown in Figure 1) were the polar opposite.
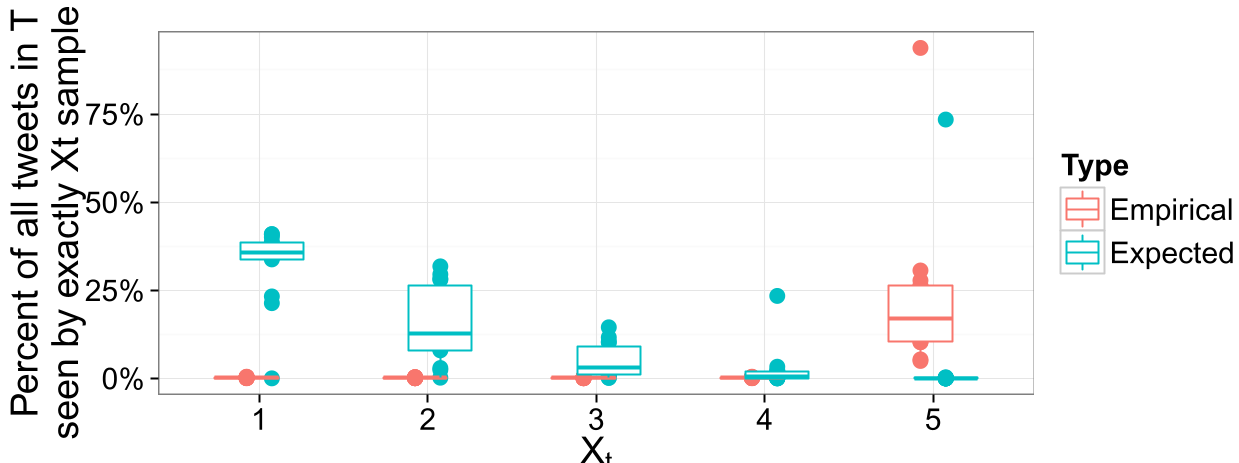
- The Findings: Over 96% of tweets were found in all five samples.
- The Implication: Twitter's infrastructure likely generates a single "sample stream" and broadcasts it to all API consumers. The tiny 4% difference isn't a feature of random sampling—it's a technical artifact of network latency and how the API manages rate-limit notices.
Are Unique Tweets "Special"?
One might argue that the tweets not shared by all streams belong to a specific category (e.g., more popular users or specific hashtags).
The authors analyzed:
- User Metadata: Follower/Followee counts.
- Tweet Structure: Number of hashtags, URLs, and mentions.
- Positioning: Where the tweet appeared relative to the API's "limit notice."
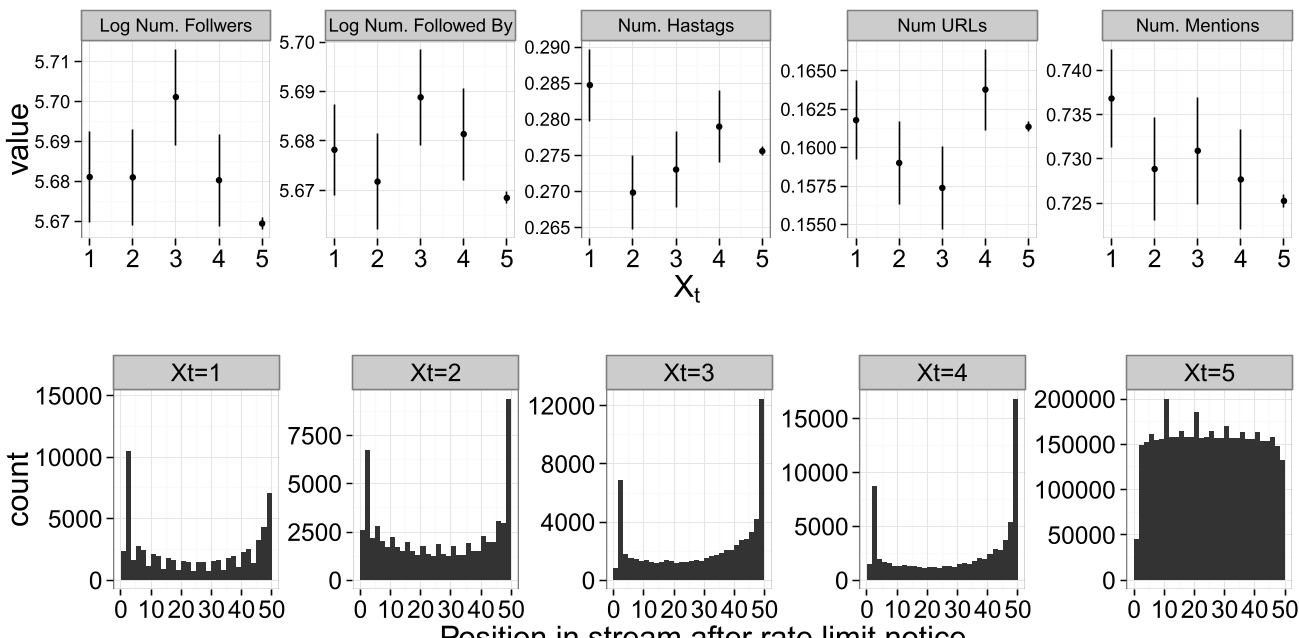
The results showed no practically significant difference in user or tweet features. The only variable that mattered was the "position metric"—unique tweets tended to cluster around the moments the API sent rate-limiting messages. This reinforces the "Technical Artifact" theory: the differences are just "glitches" in the delivery line, not a systematic bias.
Critical Insight: The "Infinite Connections" Problem
Using a derived mathematical proof, the authors demonstrate that if you wanted to capture 95% of the full stream via the Streaming API, you wouldn't just need a few more connections—you would need effectively infinite connections. Because the samples are so redundant (highly correlated), adding new connections provides diminishing returns that reach a horizontal asymptote very quickly.
Conclusion & Future Impact
This work provides a sigh of relief for researchers worried about their specific sample: your 1% is likely the same as everyone else's 1%. Your findings are reproducible within the context of the Streaming API.
However, it remains a cautionary tale for those attempting to "hack" the system. To get more data, you must change your strategy—perhaps moving toward user-based tracking or geospatial bounding boxes—rather than simply increasing the volume of keyword-based listeners.
Limitations: The study was conducted from a single geographic IP and focused on high-volume keywords. Whether these findings hold for low-volume, niche keywords where the 1% cap is never hit remains an open question.