
Decoding the Dual Layers of Human Connection: Why All Social Links Are Not Created Equal
Two-Layered Structure of Social Network revealed by Data Analysis of Telecommun cation Services
This paper identifies a "two-layered" social network structure by analyzing massive traffic logs from voice calls and email services. The study reveals that communication patterns follow power-law distributions with distinct exponents ( for intimate/effortful communication and for automated/broadcast-style interaction), achieving a unified view of social dynamics across different telecommunication services.
TL;DR
By mining millions of traffic logs from voice calls and emails, researchers have uncovered that our "Social Network" isn't a single web, but a two-layered structure. Deep, high-effort connections (calls) follow a specific power-law (), while broad, automated interactions (mass emails) follow a much flatter distribution (). This bifurcation explains everything from how SNS grows to how computer viruses spread.
The "Single Data" Trap
For years, network scientists have obsessed over "scale-free" properties—the idea that a few "hubs" have most of the connections. However, most studies were "closed": they looked only at Twitter, or only at call logs. This paper argues that looking at a single service is like looking at a single color of a Rubik's cube. You see the pattern, but you don't see the mechanism behind the rotation.
The Discovery: vs.
The researchers analyzed two massive "spike" events in Japan: Earthquakes (triggering voice calls to family) and New Year's (triggering season's greeting emails).
The mathematical results were startlingly different:
- Voice Calls: Showed a steep decay with a power-law exponent of .
- Total Emails: Showed a much flatter decay of .
The "Effort" Insight
Why the difference? The authors hypothesized it wasn't the service (Voice vs. Email), but the effort. They split emails into:
- Single-Destination Emails: High effort, one-to-one.
- Multiple-Destination Emails: Low effort, one-to-many.
The result? Single emails behaved exactly like voice calls (). Mass emails behaved like a totally different network (). This suggests our "intimate" social circle is structurally distinct from our "broadcast" circle.
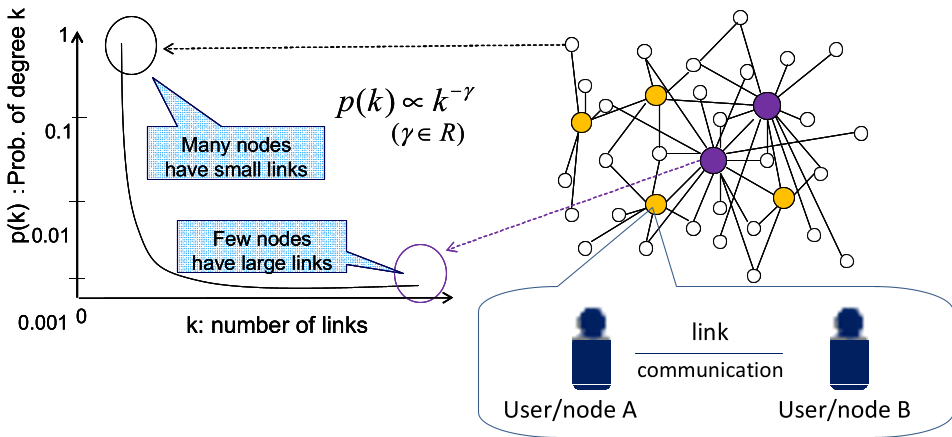 Figure 1: The conceptual framework where users (nodes) and their telecommunication links form a scale-free graph.
Methodology: The Logic of Convergence
The brilliance of this paper lies in how it verifies these exponents by looking at seemingly unrelated phenomena:
1. The SNS Growth Connection ()
The authors link the (or in Zipf's form) layer to the growth of invitation-based SNS. If a network grows via word-of-mouth, the rate of increase () is proportional to . This perfectly matches the structure found in voice calls.
2. The Virus Propagation Connection ()
Computer viruses spread by harvesting address books—sending emails "automatically" without recipient consent. The authors found that the propagation rate of these viruses () translates mathematically to a network with an exponent of . This "automatic" behavior mimics how we send mass New Year's greetings.
Experimental Proof: The Degree Ratio
To prove these layers exist, the authors used the Degree Ratio . This metric determines how "clique-y" the most connected people are.
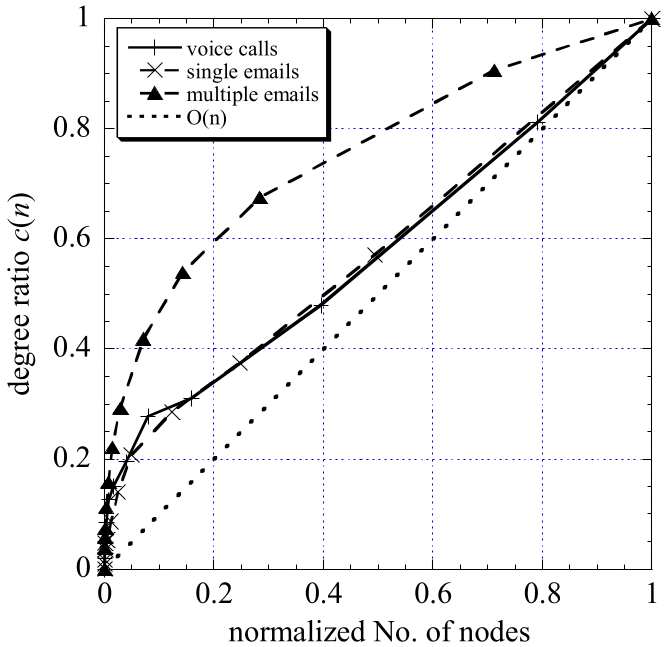 Figure 2: distribution showing that voice calls and single emails follow a linear trend, while mass emails form tight clusters.
In the layer (Intimate), the degree ratio is linear. Connectivity is stable and predictable. In the layer (Broadcast), the curve is "concave downward," meaning the "hubs" (popular people) are much more interconnected than chance would suggest, creating a massive, efficient highway for information (or virus) spread.
Critical Insight & Conclusion
This research moves us past the "one size fits all" view of social networks.
- For Product Designers: If you are building a "high-intimacy" app, your growth and user limits should be modeled around .
- For Marketers: "Viral" marketing only truly happens in the layer, where "automatic" or "low-burden" sharing occurs.
Limitations: The study relies on Japanese telecommunication data from a specific era. In the age of WhatsApp and Slack, where the line between "one-to-one" and "group" is blurred by "Read Receipts" and reactions, these exponents might shift—but the two-layered fundamental structure likely remains.