
Beyond Trending Hashtags: A Two-Stage Spatio-Temporal Event Tracking Framework
A Novel Two-Stage System for Detecting and Tracking Events in Twitter
This paper introduces a novel two-stage system for detecting and tracking events in Twitter by integrating LDA (Latent Dirichlet Allocation) for semantic topic discovery with a density-contour-based spatio-temporal clustering approach. The system effectively maps high-density event regions (hotspots) and tracks their evolution using a family of newly formulated area-weighted distance functions.
TL;DR
To truly understand "what is happening now" on Twitter, we need more than just keywords; we need to know exactly where and how discussions are moving. This paper presents a two-stage system that first extracts semantic topics via LDA and then tracks them across geography using density-contour clustering. By introducing the concepts of "absolute" vs "relative" density, the system can distinguish between a major news event discussed by everyone and a localized crisis affecting a specific neighborhood.
The Problem: The Noise of the Crowd
Most Twitter analytics tools focus on global trends. However, for applications like disaster management (e.g., snowstorms) or social unrest (e.g., riots), the geographic "footprint" of an event is its most critical attribute. Prior works often struggle with two things:
- Complexity: Parallel processing of text and location is computationally expensive.
- Population Bias: In absolute terms, a city like New York always creates more tweets. This "absolute density" hides smaller, high-intensity events happening in smaller towns—a classic problem in spatial statistics.
Methodology: From Words to Polygons
The proposed system operates in a "serial" fashion, which the authors argue is more efficient and interpretable than parallel models.
Stage 1: Semantic Anchoring
The tweet stream is carved into temporal windows. LDA (Latent Dirichlet Allocation) identifies latent topics. Each tweet is then "labeled" with its most probable topic. For example, during the 2014 Buffalo snowstorm, the system identified a shift in topic keywords from "waiting for snow" to "stuck/closed/help" as the storm progressed.
Stage 2: Spatio-Temporal Contouring
Once tweets are labeled (e.g., "Topic: Snowstorm"), their coordinates are fed into a Kernel Density Estimation (KDE) model.
- Contour Polygon Trees (CPT): The system utilizes a contouring algorithm (marching squares) to generate multi-layer polygons representing different density thresholds.
- The Secret Sauce: Relative Density: Instead of just looking at the number of "snow" tweets, the system looks at the ratio of "snow" tweets to "total" tweets in a region. This allows the model to find hotspots in rural areas where total tweet volume is low but the event's impact is high.
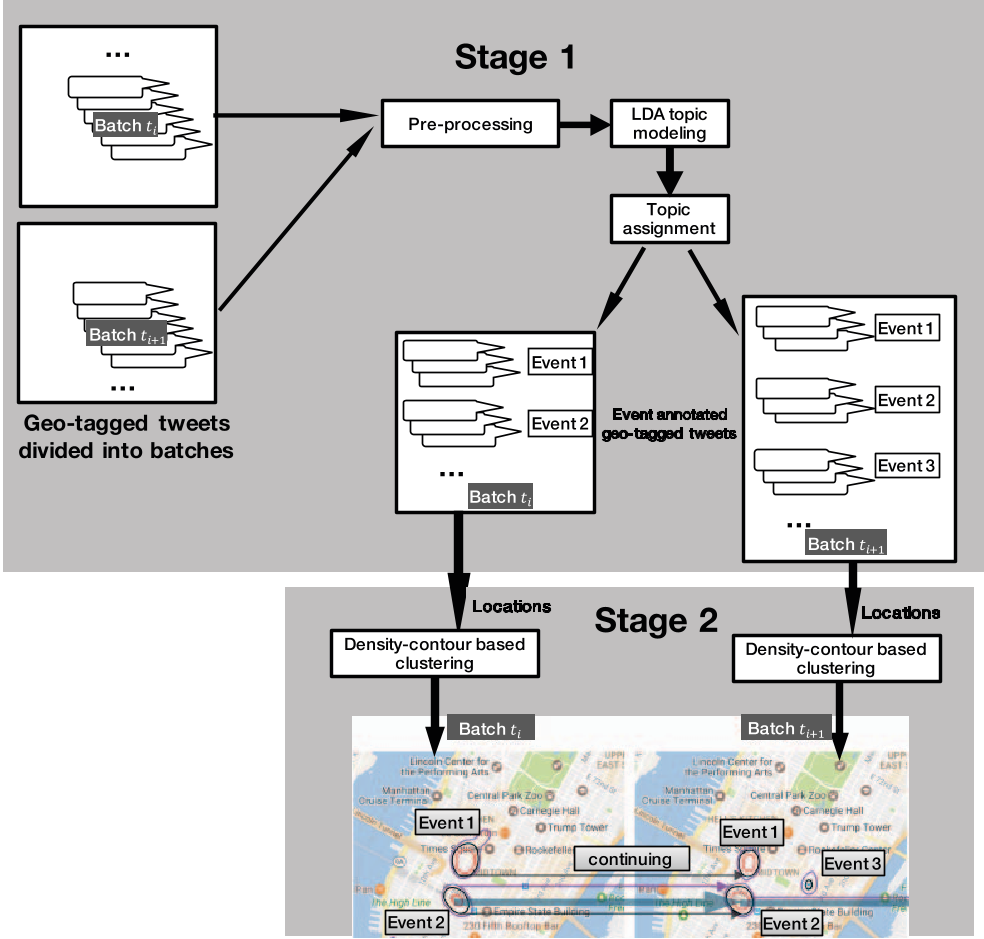 Figure 1: The two-stage architecture integrating LDA and Spatio-Temporal Clustering.
Establishing Continuity: Connecting the Dots
A key contribution of this paper is how it "links" events over time. The authors define a family of Area-Weighted Distance Functions.
- Topic Continuity: Measured via KL-divergence between the word distributions of topics in consecutive time slices.
- Spatial Continuity: Measured using a custom distance function that calculates the Overlap/Union (IoU) of polygons, weighted by their area to ensure robustness against minor noise.
Experimental Insights: Buffalo and Ferguson
The authors validated the system using two high-impact events:
- Buffalo Snow Storm: While absolute density highlighted New York City (due to its massive population discussing the news), the relative density model accurately pinpointed Buffalo as the epicenter where the storm actually hit.
- Ferguson Riots: The system tracked the intensity of the riots as they moved from a general discussion (Nov 24) to intense localized activity in Ferguson (Nov 26).
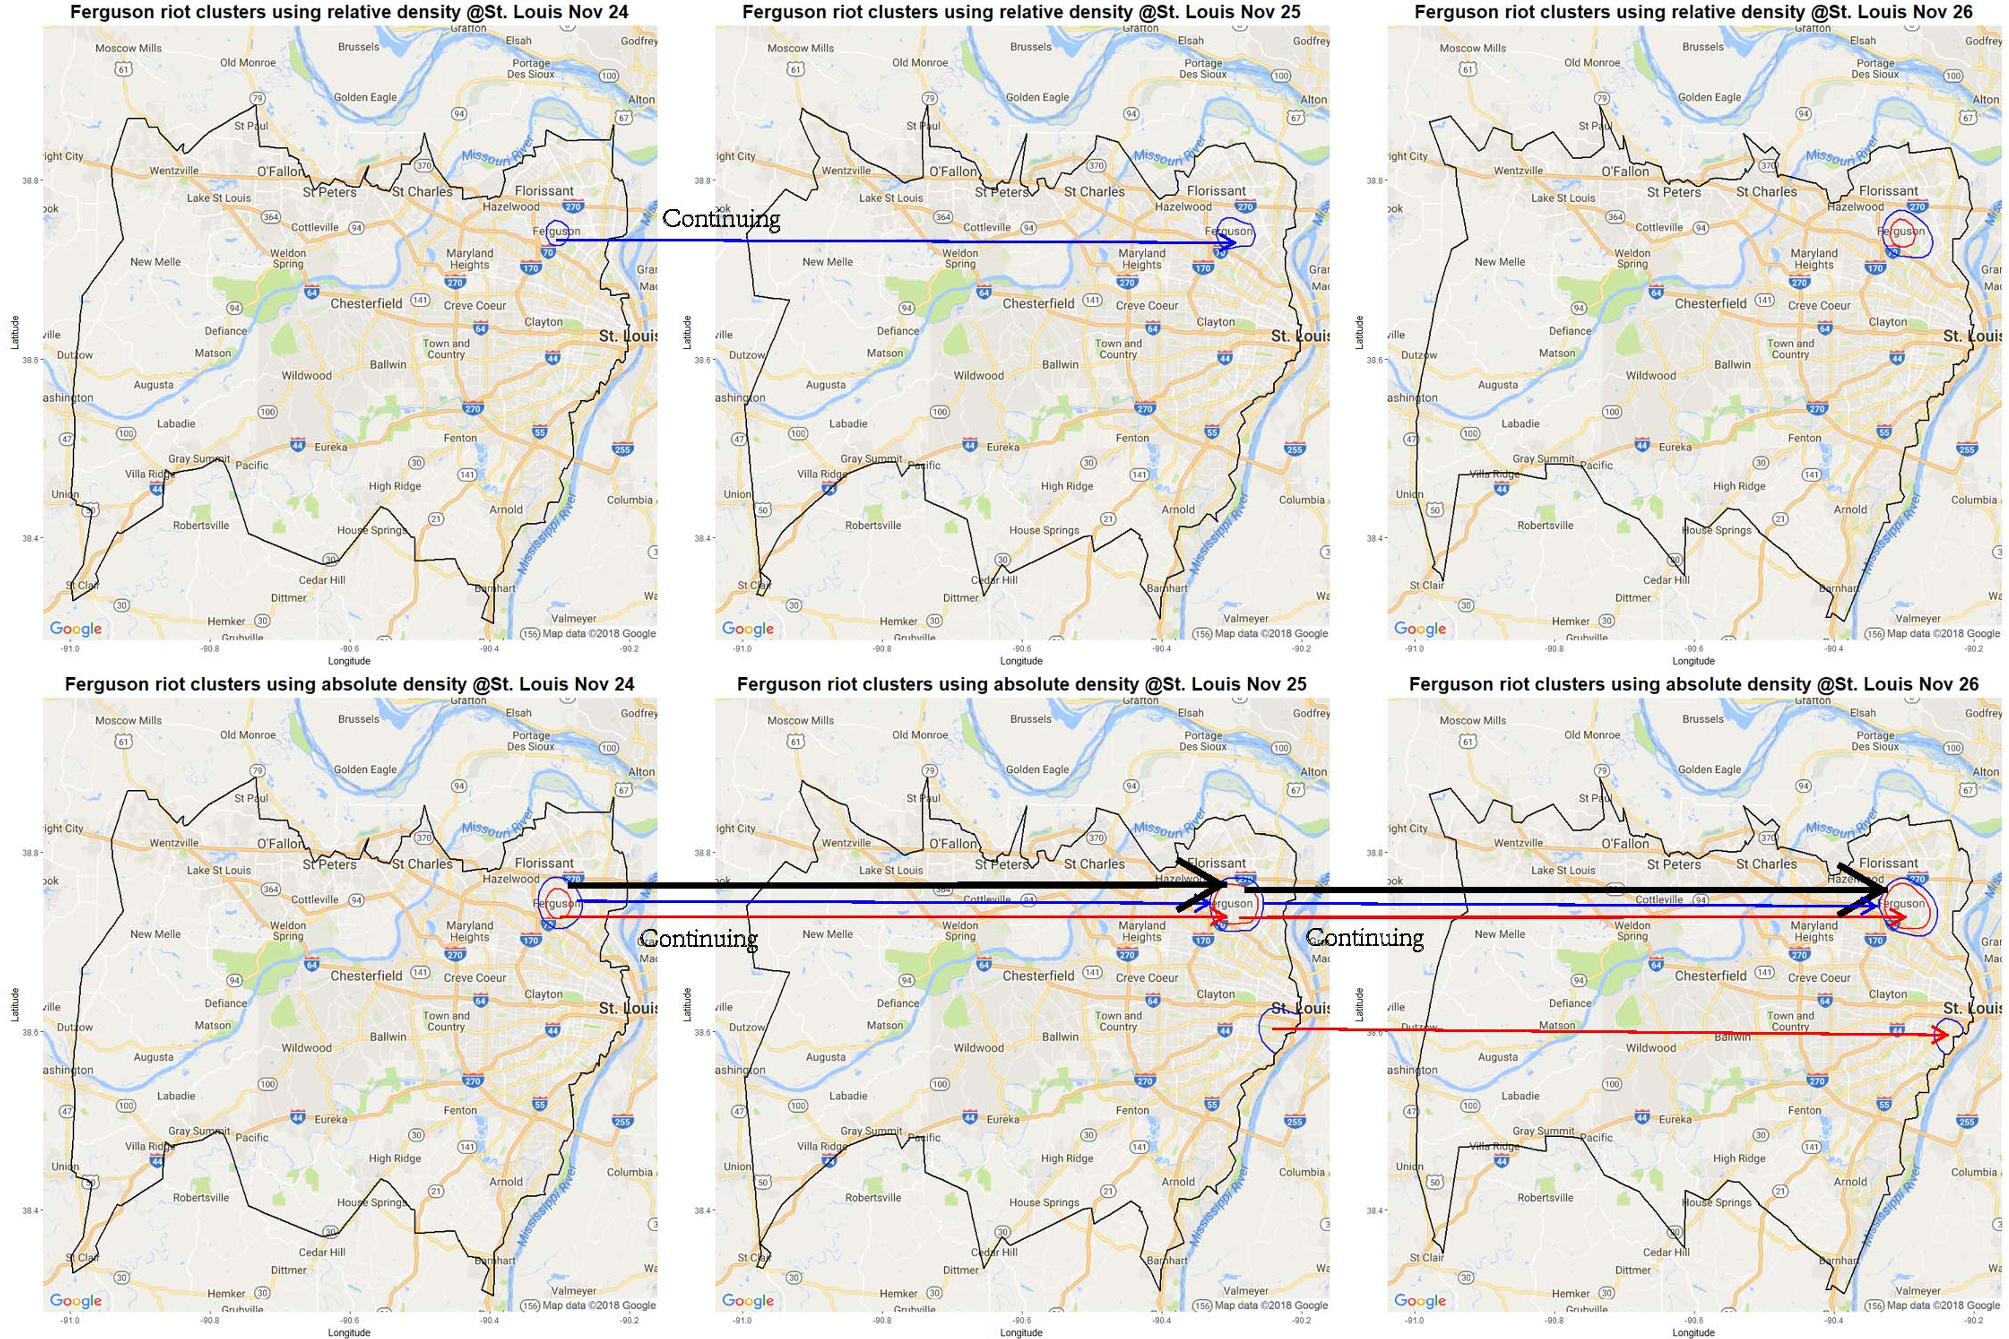 Figure 2: Tracking the Ferguson riots using Relative Density vs. Absolute Density at a city level.
Critical Analysis & Conclusion
The strength of this work lies in its "Drill Down" capability. By rerunning the second stage on specific dense regions, researchers can pivot from state-level views down to neighborhood-level granularity.
Limitations:
- LDA on Short Text: LDA is notoriously difficult to tune for the sparse, noisy nature of tweets (140-280 characters). Modern "Short Text Topic Models" (STTM) or Embedding-based clusters might offer more stability.
- Batch Processing: The current system is batch-oriented. While the authors mention future work on a real-time engine, the "serial" nature might introduce latency compared to pure stream-processing frameworks.
Final takeaway: This paper provides a rigorous mathematical bridge between NLP and Spatial Statistics, proving that "where" someone tweets is just as important as "what" they say when tracking the pulse of the world.