
Mapping the Gift of Life: How Network Science Uncovers Inefficiencies in US Organ Transplantation
Understanding organ transplantation in the USA using geographical social networks
This paper introduces a Network Science approach to analyze organ transplantation in the USA by constructing Geographical Social Networks (GSNs) at state and zipcode levels. By mapping decades of UNOS data, the researchers identify structural inefficiencies, geographical disparities, and the existence of "donor/recipient hotspots" that challenge current allocation policies.
TL;DR
Despite over 100,000 Americans waiting for transplants, the system is plagued by inefficiencies where 20% of available kidneys go unused. This research applies Network Science to decades of UNOS data, revealing that organs don't just move between hospitals—they flow through a Geographical Social Network (GSN). The findings show a striking imbalance: rural America is effectively "exporting" organs to supply urban centers like NYC and LA, while current regional policies often ignore underlying social and ethnic clusters.
The "Commodity" of Organs: Why Mapping Isn't Enough
Traditionally, organ allocation is viewed through the lens of logistics—getting an organ from Point A to Point B before it degrades. However, this paper argues that organs act as a commodity flowing through communities. The researchers identified a massive disconnect between supply and demand that isn't just about the number of donors, but where they are and how they are connected.
The authors highlight a critical "Prior Work" limitation: current policies prioritize locality, but "locality" is defined by arbitrary administrative regions rather than the actual social and functional connections between cities and states.
Methodology: Building the Geographical Social Network (GSN)
The researchers transformed flat UNOS records into a weighted, directed graph.
- Nodes: Represent Zipcodes or States.
- Edges: Represent a successful transplant between a donor's residence and a recipient's residence.
By using the Blondel algorithm for community detection, they could see if the "natural" communities formed by transplant data matched the 11 official UNOS regions.
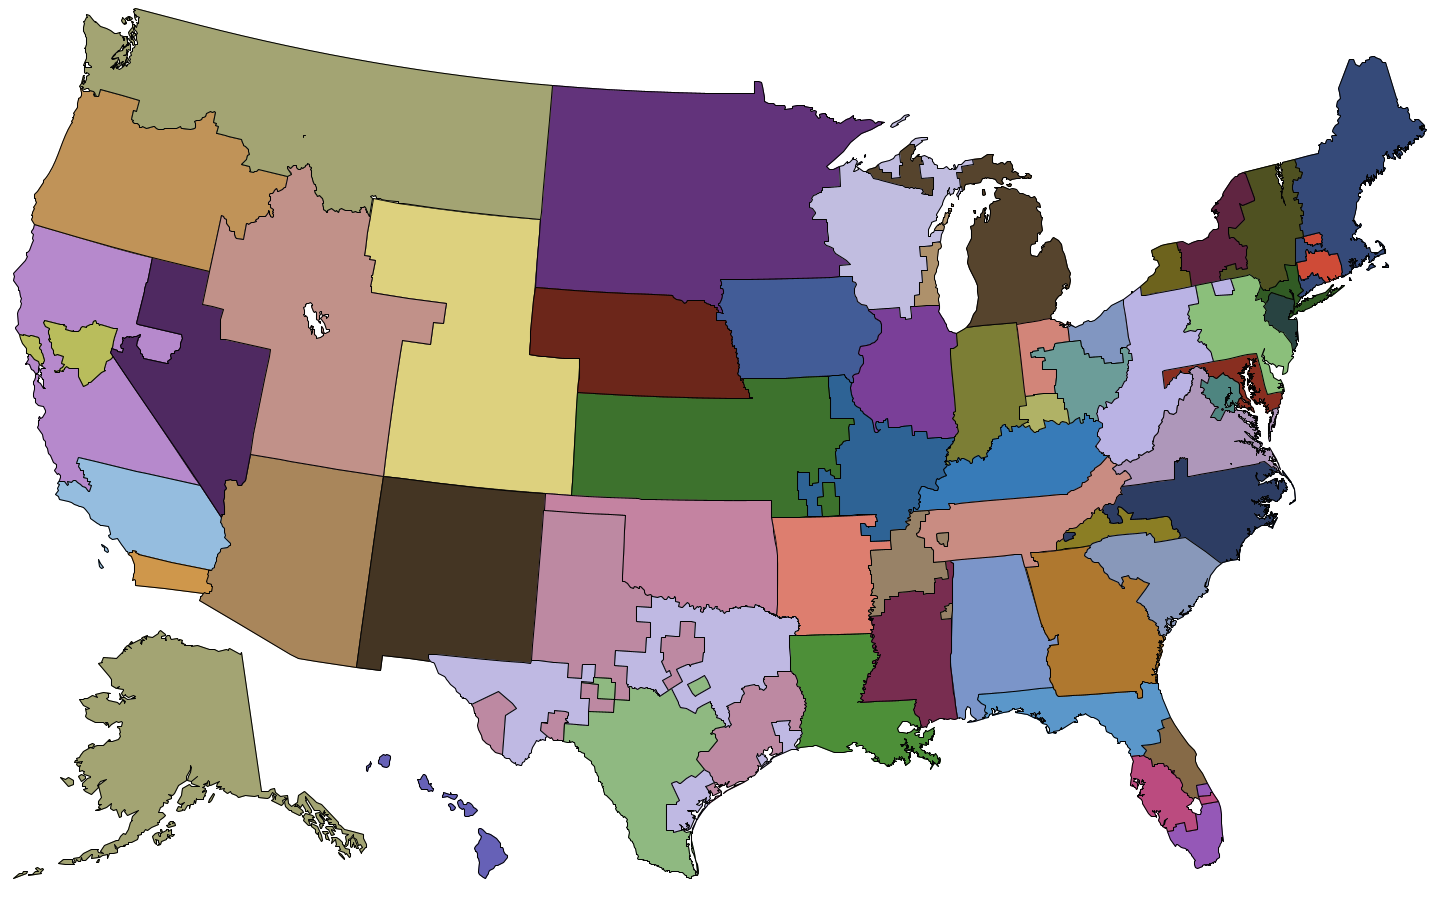 Figure 1: The official UNOS regions (top) versus OPO regions (bottom). The study tests if data actually follows these lines.
Key Insights: Rural Suppliers and Urban Consumers
Using heatmaps, the study identifies "Hotspots." Ideally, a map should show a balance of donors (green) and recipients (red). Instead, the data reveals a stark urban-rural divide.
- Urban Drain: Cities like New York, Chicago, and Los Angeles are massive "red" hotspots (recipient-heavy).
- Rural Supply: Less urbanized areas consistently show an excess of donors.
- The Education Connection: Within cities, a "donut" pattern often emerges (e.g., Atlanta), where affluent, educated outskirts are donor-heavy, while the inner city is recipient-heavy.
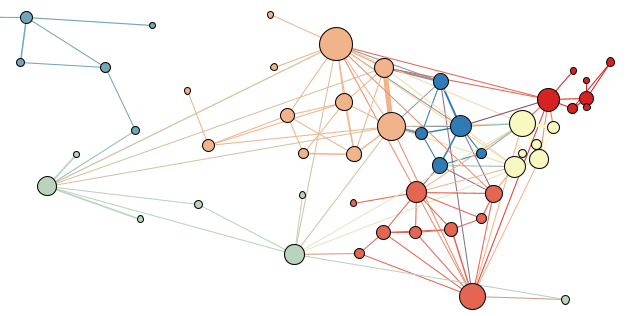 Figure 5: Community detection shows that while Heart (f) and Liver (c) networks are geographically tight, others like Intestine (e) are fragmented and chaotic.
Scaleless Networks, but Not "Small Worlds"
One of the most profound technical findings is that the GSN is Scale-Free (following a Power Law distribution with for most organs), but unlike most social networks, it is not a "Small World".
- Why? In a friendship network, if A knows B and B knows C, A likely knows C (high clustering). In transplantation, organs don't "cycle." A donor gives an organ once. This lack of "triplets" results in a very low clustering coefficient, identifying a unique topology in medical networks.
Dispelling the Myth: Unhealthy Habits and Allocation
A common ethical concern is whether organ allocation is biased by lifestyle. The researchers correlated transplant data with:
- Smoking Levels (vs. Lung Transplants)
- Alcohol Consumption (vs. Liver Transplants)
- Obesity Rates (vs. Heart Transplants)
The Result: There is zero to weak correlation between a state's unhealthy habits and the number of organs they receive. This suggests the medical "urgency" and "need" filters in current policies are functioning as intended, largely ignoring lifestyle factors in favor of clinical necessity.
Conclusion and Future Outlook
This work shifts the focus from "how many donors" to "how the network is structured."
Takeaways:
- Policy Reform: UNOS regions should be redrawn to match actual community flow discovered in GSNs, particularly for kidneys where social/ethnic clusters span across current regional lines.
- Targeted Awareness: Social programs shouldn't be "national"; they should target specific urban recipient hotspots and the educational factors driving the "inner-city" donor shortage.
Limitations: The study relies on 2012-era data; a modern update including the impact of COVID-19 on organ health and the recent changes in liver allocation (MELD scores) would be the natural next step in this research lineage.