
The Anatomy of Virality: How Network Topology Drives Information Cascades
Understanding Spreading Patterns on Social Networks Based on Network Topology
This paper introduces a novel meme propagation model that utilizes meso-scale network properties (SCCP: Scale-free, Communities, and Core-Periphery) to simulate information cascades. By categorizing nodes into core and periphery roles and assigning hierarchical infection probabilities, the authors successfully replicate real-world virality patterns observed in the Higgs Twitter dataset.
TL;DR
Why do some memes disappear while others take over the world? This paper reveals that the answer lies in the topology of our social networks. By modeling networks with "Core-Periphery" and "Community" structures, the researchers from IIT Ropar developed a propagation model that accurately predicts virality by treating different social links with different "infection" weights.
Deep Dive: The Problem with Uniformity
In classical network science, we often treat every "handshake" or "follow" as equal. However, the real world is messy. Prior works often ignored that social networks aren't just random clusters; they are SCCP networks—Scale-free, Communities, and Core-Periphery structures. The missing link in traditional models was the failure to account for how a "core" user (an influencer or a hub) interacts differently with a "peripheral" user (a casual follower).
Methodology: The Hierarchy of Influence
The core insight of the authors is the Probability Hierarchy. They categorized every edge in a network into five distinct types based on whether the sender and receiver were in the "Core" or "Periphery."
The proposed hierarchy is mathematically defined as:
- Core-to-Core (): The highest probability. If the "hubs" are talking to each other, the meme is unstoppable.
- Core-to-Periphery (): How influencers broadcast to the masses.
- Periphery-to-Periphery (): Echo chambers within a single community.
- Periphery-to-Core (): The lowest probability. It is very hard for a casual user to "infect" a major hub.
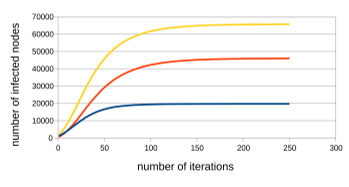 Figure 1: Comparison of the proposed spreading model across different network types (Facebook, SCCP, and Random).
Results: The "S-Curve" of Success
The team validated their model against the Higgs Twitter Dataset, which tracked how news of the Higgs Boson discovery spread.
Key Findings:
- The Core Catalyst: In simulations starting from peripheral nodes, the infection grew slowly. However, the moment the "Core" nodes were infected, the growth curve turned vertical.
- Proposed vs. Uniform: While both models produce "S-curves," the proposed model reaches the "tipping point" much faster.
- Real-World Validation: The simulation results on the generated SCCP networks almost perfectly overlapped with the actual Twitter data.
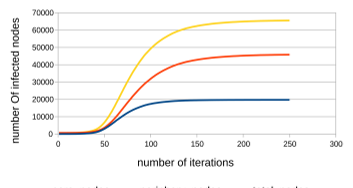 Figure 2: Impact of starting nodes. Notice the drastic spike when the infection starts from Core nodes (b) vs. Periphery nodes (a).
Critical Analysis & Conclusion
The value of this work lies in its structural realism. By acknowledging that not all nodes are created equal, it provides a blueprint for marketers, epidemiologists, and social scientists to identify the "tipping points" of a network.
Limitations: The model currently treats the network as static. In reality, core-periphery structures can shift during a crisis (e.g., new experts emerging during a pandemic).
Takeaway for the Future: This research suggests that to stop a virus (biological or digital), we shouldn't just look at the number of people infected, but where in the hierarchy they sit. Targeting "Core" nodes isn't just a strategy—it's the only way to shift the curve.