
Decoding the Global Pulse: A Multi-Million User Study of Foursquare Behavior
Understanding the User Behavior of Foursquare: A Data-Driven Study on a Global Scale
This study presents the first global-scale analysis of Foursquare, covering 61.43 million users and 55.18 million "tips." It employs a distributed crawling framework to map the global social graph and uses supervised machine learning (XGBoost) to predict user influence based on profile and activity data.
TL;DR
Researchers have finally mapped the "inner workings" of Foursquare on a global scale, analyzing 60+ million users. By shifting focus from defunct check-in data to "Tips" (UGC), the study reveals a surprisingly connected global social graph and proves that we can identify "influencers" with 87% accuracy using only public profile data—no friend lists required.
Context: Why Foursquare Still Matters
While many dismiss Foursquare as a relic of the "check-in" era, it remains a goldmine for Location-Based Social Network (LBSN) research. Previous studies were often "blinded" by biased data—sampling only users who cross-posted to Twitter. This paper breaks that mold by crawling the entire population to understand how people actually move, group, and express opinions across different cultures and time zones.
The Anatomy of a Global Social Graph
The researchers treated Foursquare as a massive directed graph. Unlike Facebook (mostly reciprocal friendships), Foursquare resembles Twitter but with higher "mutuality."
Key Structural Findings:
- Reciprocity (0.42): 42% of edges are bi-directional, significantly higher than Twitter’s ~0.20, suggesting stronger social ties.
- The "Giant" Component: A single Strongly Connected Component (LSCC) contains nearly 60% of all users, meaning most people are only a few "hops" away from each other.
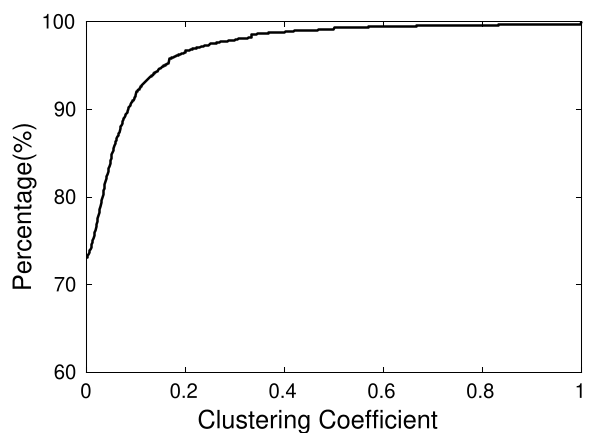
- Loose Clusters: An average clustering coefficient of 0.065 suggests that while the world is connected, local "cliques" are relatively sparse.
Deep Dive into "Tips": The New Check-in
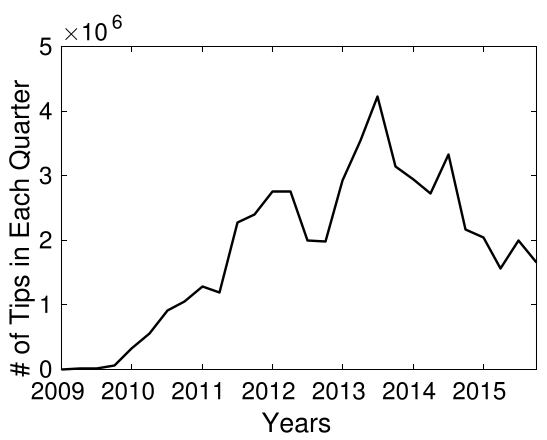
Since Foursquare split into Foursquare (tips) and Swarm (check-ins), tips have become the primary signal of user intent.
1. The Power Law of Content
The study confirms a classic "90-9-1" rule: 83.47% of users never publish a tip. However, the top 10% of users account for a staggering 92.67% of all content. If you want to understand a city's vibe, you only need to listen to a small fraction of its residents.
2. The Happiness Index ()
To quantify global sentiment, the authors proposed the Happiness Index.
- Food & Nightlife: Highest satisfaction ().
- Education & Residence: Lowest satisfaction.
- Gender Trends: Females tend to be 11.76% more active in tip-sharing and carry a slightly higher happiness index than males.
Predicting Influence Without a Graph
The most practical contribution is a machine learning model designed for third-party apps. Often, privacy settings hide a user's followers. Can we still find "Influentials" (top 0.1% PageRank)?
By using XGBoost on 10 features—such as "Does the user have a bio?", "Number of tips," and "Account links to Twitter"—the model achieved an F1-score of 0.87.
The "Influencer" Signature: The most discriminative features weren't social connections, but behavior:
- Check-in Volume: Active movers are influential.
- Tip Count: Content creators hold the most sway.
- Twitter Integration: Users who bridge multiple platforms are significantly more likely to be influencers.

Critical Insight & Future Outlook
This work shifts the paradigm of LBSN analysis from connectivity to behavioral metadata. For ISPs and urban planners, the "temporal-spatial" patterns (peaks at 1 PM and 8 PM) provide a blueprint for network resource allocation and city planning.
Limitations: The sentiment analysis was restricted to English tips (VADER algorithm). Future work needs to bridge the linguistic gap to capture the "Happiness Index" of non-English speaking regions like Turkey and Indonesia, which represent a massive portion of the LBSN footprint.
Conclusion
The study proves that in the age of privacy, "who you follow" is less important than "what you do." By analyzing the breadcrumbs of 60 million users, we can map the social fabric of the world with unprecedented precision.