
Beyond the Label: Unsupervised PolSAR Segmentation as a Diagnostic Tool for Agriculture
Unsupervised Full-Polarimetric SAR Data Segmentation as a Tool for Classification of Agricultural Areas
The paper introduces a robust unsupervised segmentation and classification framework for full-polarimetric SAR (PolSAR) data, specifically applied to agricultural monitoring. By transforming complex covariance matrices into a nine-intensity representation and utilizing the SMIXTURE clustering strategy, the method achieves SOTA classification accuracies ranging from 84.3% to 98.0% across different radar bands (C and L) and test sites.
TL;DR
This research presents a highly efficient pipeline for processing Full-Polarimetric SAR data. By transforming complex radar matrices into a statistically manageable "nine-intensity" format and applying a robust hierarchical clustering (SMIXTURE), the authors achieved classification accuracies up to 98.0%. More importantly, the unsupervised approach revealed subtle crop variations (sub-classes) that were completely absent in the original ground truth.
The Challenge: Polarimetric Complexity vs. Statistical Simplicity
Polarimetric Synthetic Aperture Radar (PolSAR) provides a rich view of the earth's surface by capturing the phase and amplitude changes in radar waves. However, the data typically resides in a complex Hermitian covariance matrix, which is notoriously difficult to model globally due to "between-field" variations—where two fields of the same crop look different due to planting density, row direction, or moisture.
Conventional methods like Wishart classifiers or H/alpha decomposition often hit a ceiling because they either require perfect ground truth or fail to account for the spatial "texture" of agricultural landscapes. The authors argue that we need a method that is both physically grounded and statistically flexible.
Methodology: The SMIXTURE Pipeline
The authors propose a multi-stage workflow that bridges the gap between raw physics and machine learning intuition:
- The 9-Intensity Transform: Instead of working with complex matrices, the data is transformed into nine real-valued intensities (HH, VV, HV, and various cross-polarizations). The physical insight here is that in a logarithmic scale, these intensities approximate a multivariate normal distribution, making them compatible with advanced clustering algorithms.
- SMIXTURE strategy:
- Region-Growing (Step 2): Initial over-segmentation to group pixels into homogeneous "blobs."
- Hierarchical Clustering (Step 3): Using Model-based Agglomerative Clustering (MAC) to merge these blobs efficiently.
- EM Refinement (Step 4): Finding the optimal cluster parameters.
- Spatial Smoothing (Step 5): Applying a Markov Random Field (MRF) filter to ensure the final map isn't "peppered" with noise, effectively using neighboring pixel info to clean up the segments.
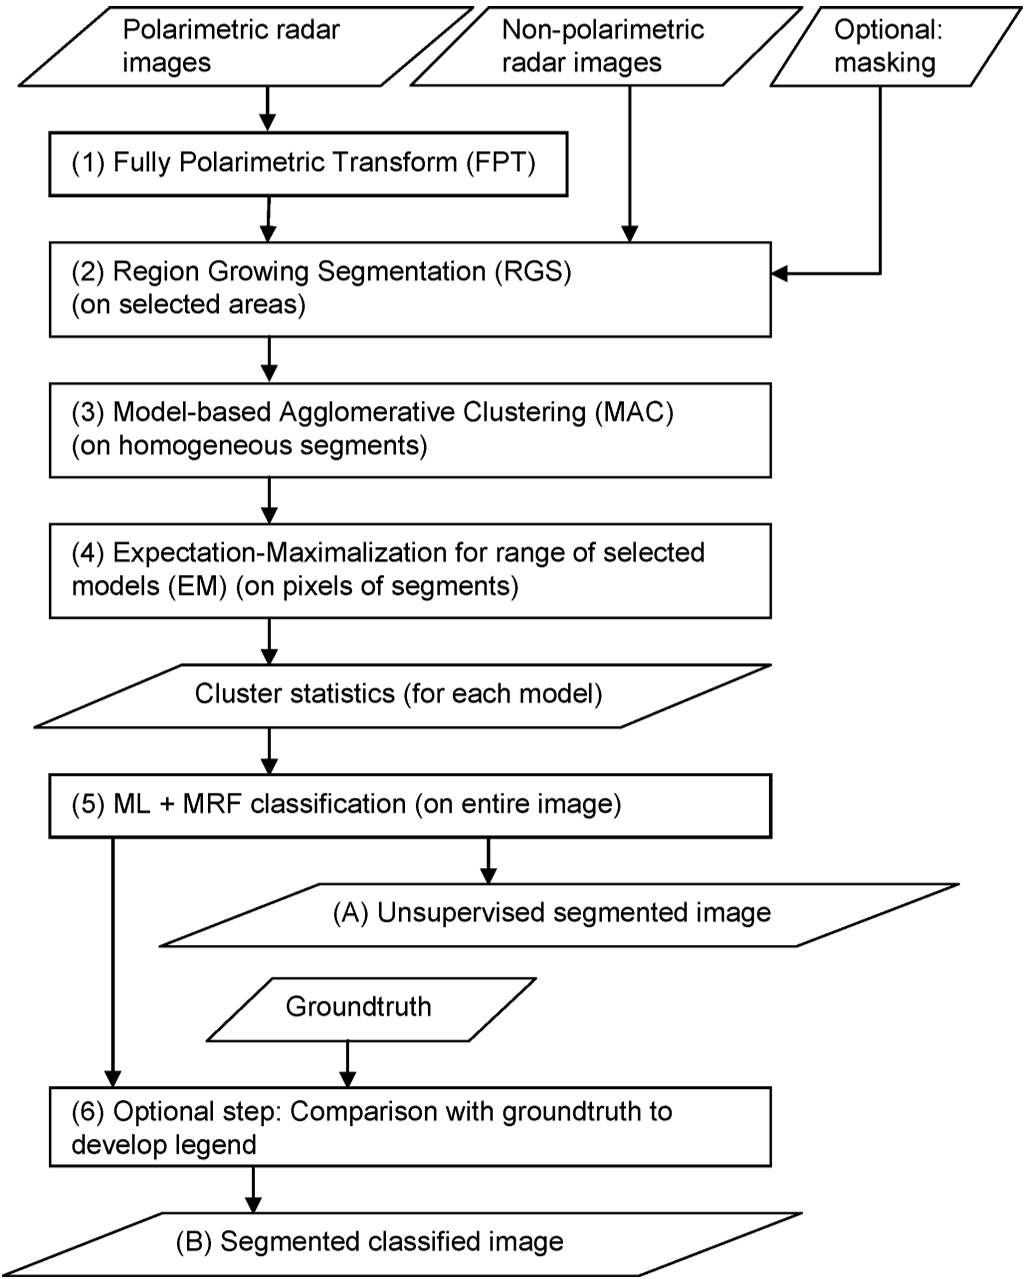 Figure 1: The Six-Step processing flow from raw SAR data to a classified map.
Experimental Battleground: Flevoland and DEMMIN
The method was tested on two iconic SAR datasets: the NASA/JPL AirSAR (Flevoland) and the DLR ESAR (DEMMIN).
Key Results:
- Accuracy: Supervised classification reached 98.0% for C&L-band combinations.
- Feature Preservation: Unlike many smoothing filters, the MRF-based approach preserved narrow line features and small objects like corner reflectors (used for calibration) as distinct classes.
- Sub-class Discovery: In the DEMMIN area, the unsupervised model "split" the wheat class into 7 sub-classes. Analysis showed these were not errors, but physical responses to different incidence angles and crop phenology (growth stages).
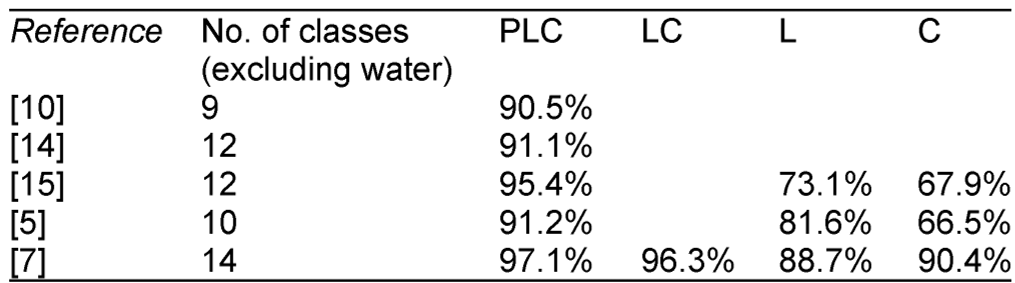 Table 1: Quantitative comparison showing that the proposed 9-intensity approach ([7] and current work) consistently leads the field in accuracy.
Critical Insight: The "Hierarchy" of Crops
One of the most fascinating aspects of this paper is the Dendrogram analysis. By allowing the model to decide how to group data, a "Bottom-Up Hierarchy" emerges. For instance:
- Potato fields split from the rest at a very early stage (Level 3), indicating a highly distinct polarimetric signature.
- Wheat and Barley are much harder to separate, only splitting into distinct categories at much higher model levels.
This hierarchy isn't just a mathematical artifact; it reflects the physics of scattering. It tells us which crops are "radar-distinct" and which require multi-temporal data to identify.
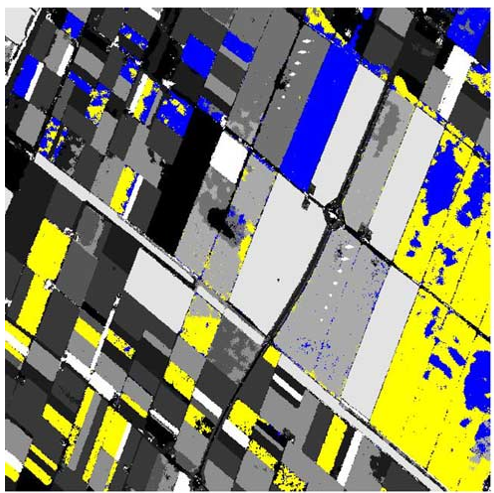 Figure 5: The natural hierarchy of crop types derived from polarimetric contrast.
Deep Insight & Conclusion
Hoekman and his team demonstrate that unsupervised learning is not just for when you lack labels—it's for when your labels are insufficient. In the DEMMIN dataset, the "set-aside rapeseed" (planted two weeks late) was clearly differentiated from standard rapeseed by the algorithm, even though human mappers had initially grouped them.
Limitations: The computational cost of hierarchical clustering on massive spaceborne datasets remains a challenge, though the region-growing pre-segmentation significantly mitigates this.
Future Outlook: This framework is perfectly positioned for the next generation of SAR sensors (like Sentinel-1 and RADARSAT-2). As we move toward global monitoring, the ability to build "ad-hoc" legends based on local physical hierarchies rather than fixed global classification schemes will be the key to high-accuracy land monitoring.