Exploring the Pulse of the City: Urban Dynamics via Mass Microblogging
Exploring urban characteristics using movement history of mass mobile microbloggers
This paper introduces a system for urban analysis using movement histories derived from mass mobile microbloggers (Twitter users). It utilizes a quad-tree-based data gathering framework and proposes two key measures—Aggregation and Dispersion—to identify and characterize urban patterns such as social events, commuting habits, and tourist activities.
TL;DR
By treating geo-tagged tweets as a "living sensor network," researchers from the University of Hyogo developed a system to map urban characteristics. Using adaptive spatial partitioning and two new metrics—Aggregation and Dispersion—they can distinguish between a business district, a transportation hub, and a tourist attraction purely through the movement patterns of Twitter users.
Background: The City as a Data Stream
In 2010, the explosion of smartphone usage and the rise of Twitter created a unique opportunity. For the first time, researchers had access to a massive, self-reported dataset of "where and when" people were moving in real-time. This paper positions itself at the intersection of Social Networking and GIS (Geographic Information Systems), moving beyond what people are saying to where they are going.
The Problem: Data Scarcity and API Limits
Prior to this work, analyzing human flow required expensive partnerships with taxi companies or laborious surveys. While microblogs offered a "zero-cost" alternative, gathering this data at scale was difficult because APIs like Twitter's often restricted searches to specific radii, making it hard to cover large countries like Japan with high precision.
Methodology: Mining the Movement
1. Adaptive Data Gathering
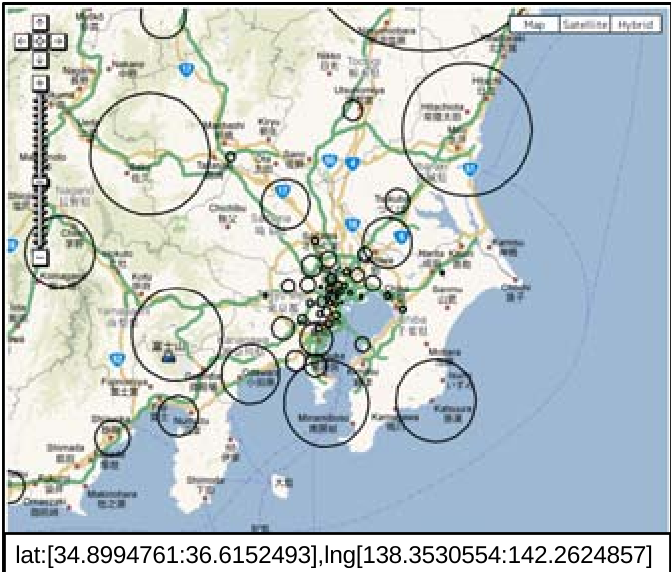
The authors didn't just crawl data; they used a Quad-tree based space splitting approach. If a specific area had too many tweets (>1,500), the system recursively split the region into smaller cells. This ensured high-resolution data in dense urban centers (like Tokyo) without wasting resources on rural areas.
2. The Movement Models
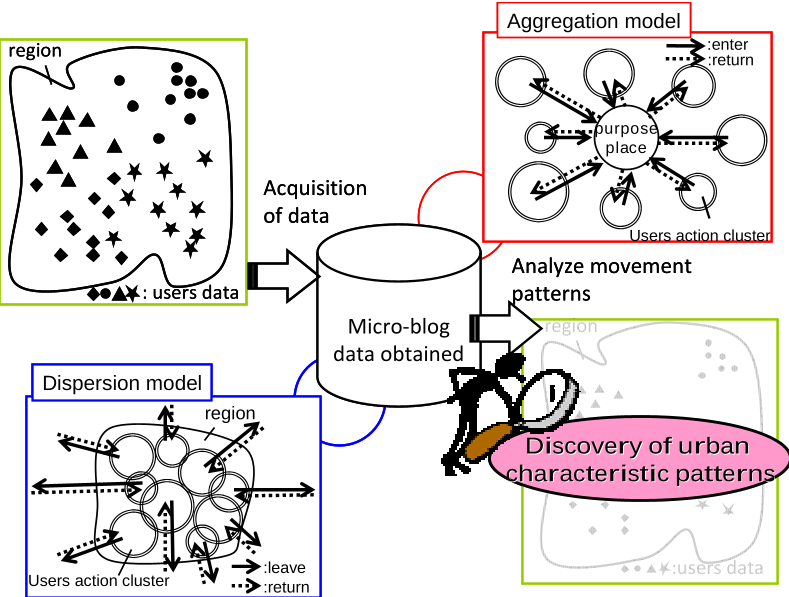
The core innovation lies in two mathematical measures:
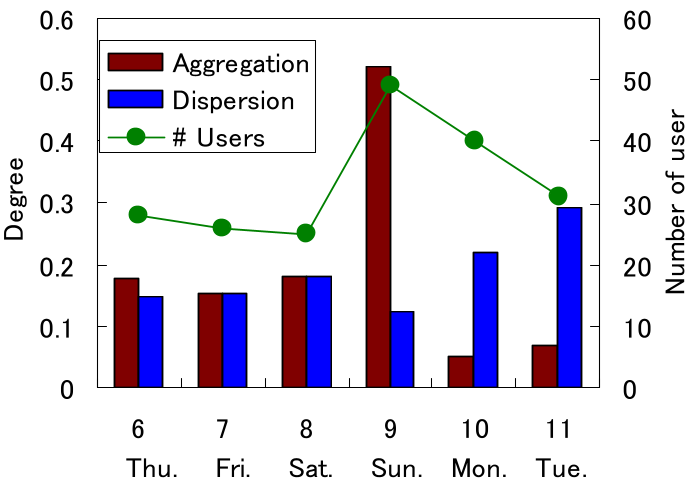
- Aggregation (C_i, t): Measures the proportion of "new" users entering a cluster compared to the previous time slot. High aggregation suggests an "attractor" like an office during the morning or a festival venue.
- Dispersion (C_i, t): Measures users who were present but have now moved to other clusters. High dispersion indicates people leaving work or heading home.
Experimental Insights: Tokyo’s Digital Footprint
The researchers applied their model to Tokyo, identifying distinct "personalities" for different neighborhoods:
- Tokyo Station (The Hub): Showed high aggregation and dispersion at all times, reflecting its nature as a transit terminal where people are constantly in flux.
- Shinagawa (The Office District): Saw a massive spike in aggregation in the morning (100%) as commuters arrived, with very little dispersion until the evening.
- Odaiba (The Tourist Spot): Exhibited 0% dispersion in the morning, meaning people arrived and stayed for the day to enjoy the amusement parks and malls, followed by high dispersion in the evening.
Deep Insights & Future Outlook
The beauty of this approach is its ability to capture social customs. The authors noted a significant drop-off in activity during the "Bon Festival" in Japan, as users left Tokyo for their hometowns.
Limitations: The study relies on users who voluntarily geo-tag their posts. This introduces a demographic bias (typically younger/tech-savvy users). Additionally, the K-means clustering used is somewhat basic; modern density-based clustering (like DBSCAN) might better handle the irregular shapes of urban neighborhoods.
Conclusion: This work paved the way for modern "Social Sensing." Today, these techniques are used for everything from disaster management (tracking movements during earthquakes) to optimizing real-estate prices based on neighborhood "liveliness."