
Decoding Geographic Social DNA: User Association in LBSNs
User association analysis of locales on location based social networks
The paper introduces a suite of Locale-Based Metrics (LCC, ILT, LAC, LABC) to analyze user associations within Location-Based Social Networks (LBSNs) using a complete snapshot of EveryTrail data. It reveals that geographic locales like New York and San Francisco exhibit significantly higher localized clustering and transitivity compared to the global network.
TL;DR
Social networks are usually analyzed as abstract graphs, but in Location-Based Social Networks (LBSNs), space defines the "why" and "how" of a connection. This paper introduces Locale-Based Metrics to prove that cities like New York and San Francisco act as social magnets, creating unique hubs of transitivity and assortativity that global metrics fail to capture.
The "Locale" Blind Spot in Social Graphs
Most social network analysis treats a link between User A and User B as a binary state. Even "geographic" models often simplify this to the distance between coordinates. However, human behavior is rooted in locales—cities, neighborhoods, or scenic spots.
The authors argue that existing metrics like the Clustering Coefficient (how likely your friends are to be friends) ignore whether these interactions happen because of a shared physical playground. They set out to answer: Do people in high-activity cities form tighter social circles? And do "outsiders" follow "insiders" differently depending on the city?
Methodology: Redefining Network Anatomy
The researchers crawled EveryTrail, a trip-sharing LBSN, and defined four key metrics. The core innovation is the distinction between Inside Users (those active in a specific city) and Outside Users.
1. Locale Clustering Coefficient (LCC)
Instead of looking at a user’s global friend circle, LCC looks at the sub-graph formed only by people active in the same locale.
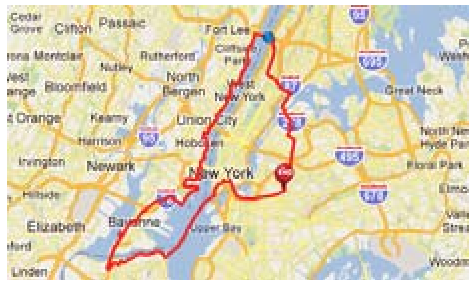 Figure 1: Trajectory data provides the ground truth for defining locales.
2. Inward Locale Transitivity (ILT)
This measures the "magnet effect." It quantifies the degree to which an outside user follows multiple people within a specific locale, essentially treating the locale itself as the point of interest.
3. Assortativity vs. Assortability
- Assortativity (LAC): Do users with many followers follow those with many followees?
- Assortability (LABC): Do popular users (high in-degree) follow other popular users?
Key Findings: The NYC & San Francisco Effect
The results from the EveryTrail dataset highlight a stark contrast between urban hubs and smaller locales.
| Metric | New York | San Francisco | Global Average |
|---|---|---|---|
| LCC (Localized) | 0.225 | 0.284 | 0.058 |
| Assortativity | 0.573 | 0.524 | 0.159 |
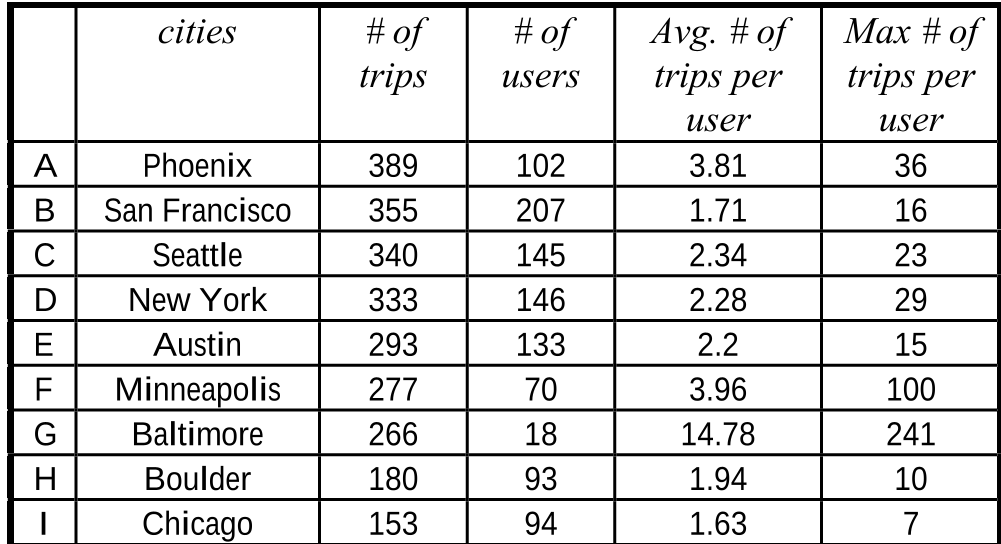 Table 1: Basic statistics showing the density of trips in key cities.
The Density Paradox
The study found that LCC is proportional to the number of trips in a city. Richer activity levels (more trails/content) act as a catalyst for social bonding. Interestingly, in cities like Chicago or Baltimore, the social structure was "star-like," meaning users were connected to a central figure but not to each other. In contrast, NYC and San Francisco showed a "web-like" structure where users were highly interconnected.
Critical Insight: Why This Matters
The most striking discovery is the Inward-Pair phenomenon. In every single city studied, the number of "Outside users following Inside users" was significantly higher than the reverse.
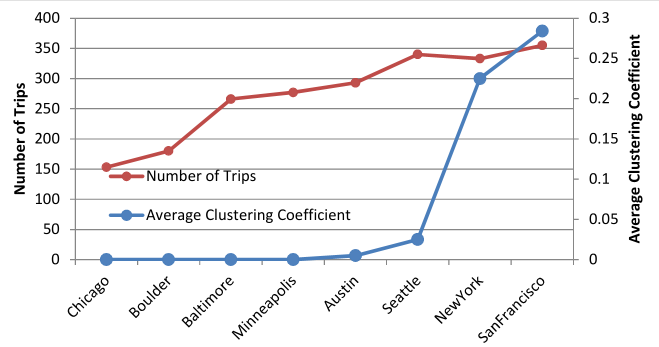 Figure 2: Inward Transitivity explains how locales attract outside attention.
This proves that LBSNs function as a digital window for "virtual tourism." People follow residents of NYC not necessarily because they know them, but because they are interested in the locale itself.
Conclusion & Future Outlook
This paper provides a robust framework for understanding the "spatial influence" of users. While the dataset (2011) reflects an earlier era of LBSNs, the Locale-Based Metrics remain highly relevant for today's hyper-local marketing and GIS-based social analysis.
Limitations: The study relies on city-level granularity. Future work could apply these metrics to much finer locales (e.g., individual parks or malls) or integrate temporal dynamics—analyzing how these coefficients change during major events like festivals.