
Establishing Earth Observation Priorities: A Cross-Sectoral Strategy for Maximum Societal Benefit
6258_A User-Driven Approach to Determining Critical Earth Observation Priorities for Societal Benefit.
The paper presents a cross-sectoral meta-analysis to identify and rank critical Earth observation priorities based on a user-driven process. By analyzing nine Societal Benefit Areas (SBAs) defined by the Group on Earth Observations (GEO), the study establishes a systematic ranking of 152 fundamental observations, identifying Precipitation and Soil Moisture as the highest global priorities.
Executive Summary
TL;DR: This landmark study shifts the Earth observation paradigm from technology-push to user-pull. By synthesizing requirements from nine societal benefit areas (from Health to Disasters), the authors identified 152 critical observations and ranked them using an ensemble of statistical methods. The result is a rigorous shortlist of the most essential environmental parameters required by the global community.
Background Positioning: This work represents the first comprehensive meta-analysis of global Earth observation priorities. It serves as a strategic blueprint for organizations like NASA, NOAA, and GEO to align multi-billion dollar satellite missions with actual user needs across diverse sectors.
Problem & Motivation: Beyond "Single-Silo" Sensors
In the past, Earth observation missions were often designed within narrow silos—a "weather satellite" for meteorologists or a "land imager" for foresters. However, Earth systems are deeply interconnected. A data provider's failure to understand cross-sectoral needs leads to:
- Suboptimal Investments: Funding missions that serve only a niche group while ignoring high-impact variables.
- Compatibility Gaps: Designing systems that lack the interoperability required by "intermediate users" (scientists) and "end users" (policy makers).
The authors' insight was that by analyzing where needs overlap (commonality), we can identify the "Essential Variables" that provide the highest return on investment for society.
Methodology: The Two-Stage Meta-Analysis
The researchers utilized a robust, two-stage process to transform qualitative user needs into quantitative rankings.
Stage 1: Individual SBA Deep-Dives
For each of the nine SBAs (Agriculture, Biodiversity, Climate, Disasters, Ecosystems, Energy, Health, Water, and Weather), an analyst and an international advisory group performed a massive literature review, scanning over 1,700 documents.
Stage 2: Cross-SBA Ensemble Ranking
To ensure the final ranking wasn't biased by one specific statistical method, the authors used an ensemble approach:
- Frequency Analysis: Counting how many SBAs requested a specific variable.
- Weighted Tallies: Giving more "points" to variables labeled as "High Priority" vs. "Medium" or "Low."
- Bias Mitigation: Using the "15 Most Critical" list to ensure an SBA with many variables (like Ecosystems) didn't overshadow an SBA with fewer variables (like Energy).
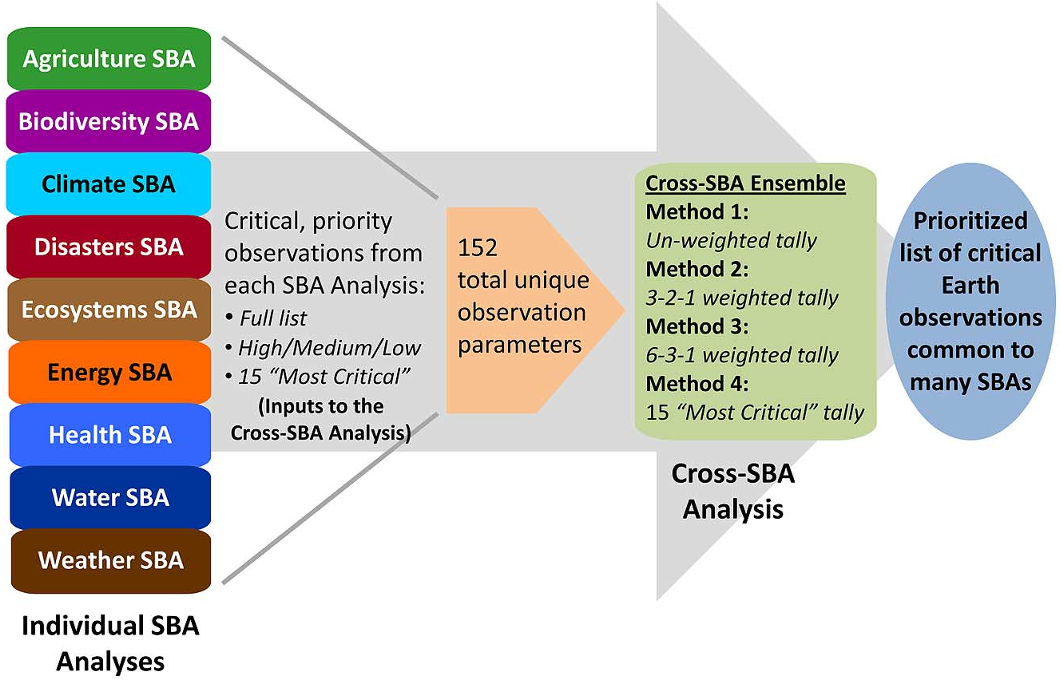 Figure 1: The 9-step process used to bridge document-stated user needs with final cross-sectoral rankings.
Key Results: The "Global Top 10"
The analysis yielded a definitive ranking. The top variables are those that are "interoperable"—they feed into the models of multiple disciplines simultaneously.
The Top 10 Critical Observations:
- Precipitation
- Soil Moisture
- Surface Air Temperature
- Land Cover
- Surface Wind Speed
- Vegetation Cover
- Surface Humidity
- Urbanization
- Vegetation Type
- Sea Surface Temperature (Tie)
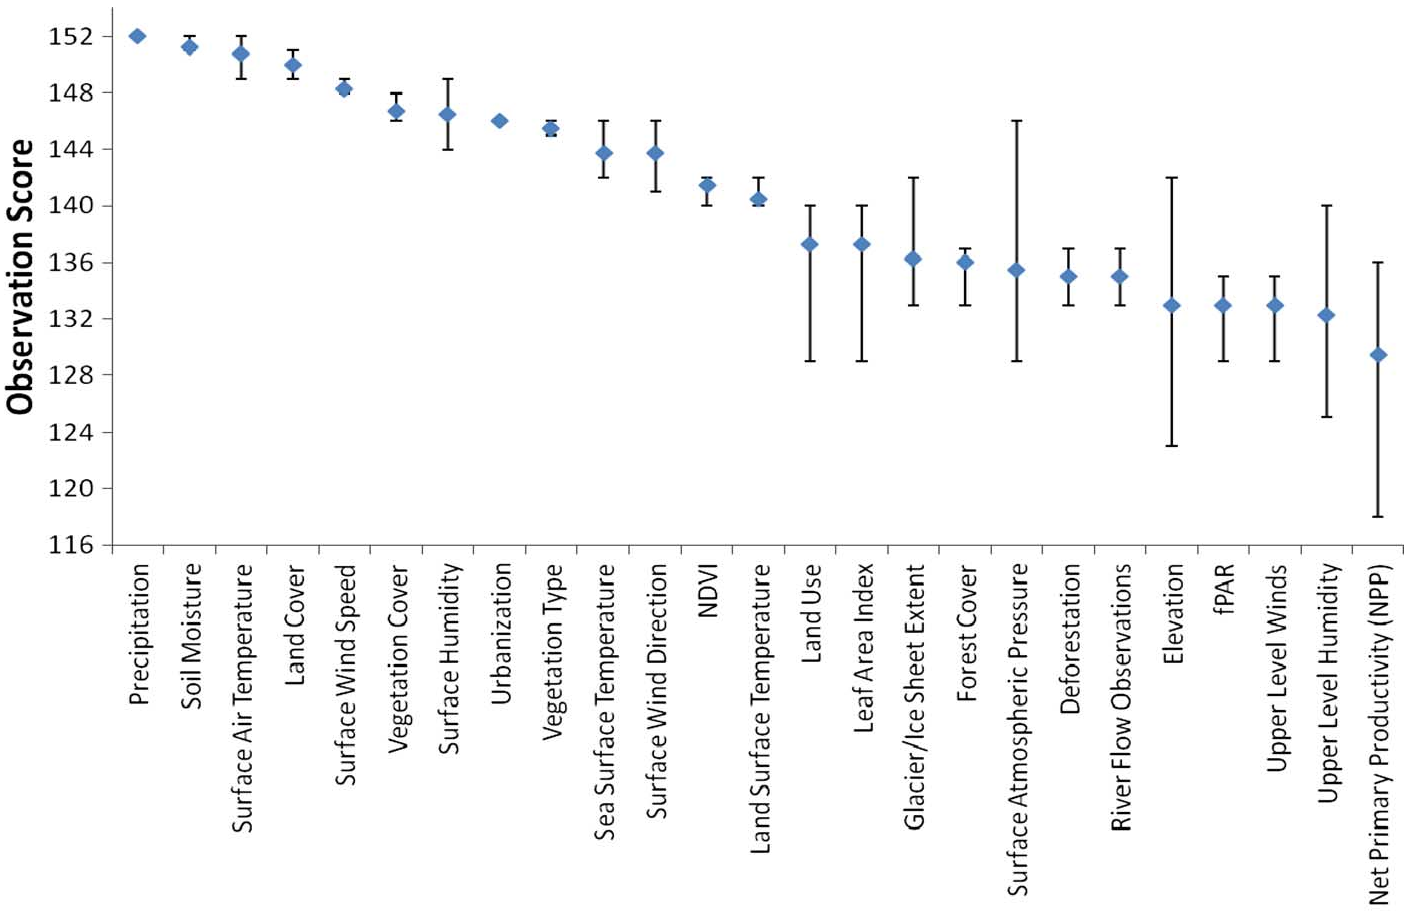 Figure 2: The top 25 Earth observations. The small error bars on the top 10 indicate that these priorities are statistically robust regardless of the ranking method used.
The study also highlighted the "Commonality Matrix." As shown in the data, variables like Precipitation and Soil Moisture are critical for all nine societal benefit areas, making them the most high-leverage data points for international monitoring systems.
Critical Analysis & Conclusion
Takeaway
The core contribution of this paper is the quantification of commonality. It proves that investing in high-quality Precipitation and Soil Moisture data isn't just a win for weather forecasting; it's a critical upgrade for global health (disease mapping), agriculture (crop yields), and tragedy prevention (floods/landslides).
Limitations
- Geographic Bias: The reliance on English-language documents and the difficulty in recruiting technicians from regions like Africa may have under-represented specific regional needs.
- Evolving Needs: The paper acknowledges that "Essential Climate Variables" may shift over time as climate change creates new, unanticipated urgencies.
Future Outlook
This work sets the stage for "Interoperable Architecture." Future research must move beyond "what" to measure and define the "how"—specifically the accuracy, latency, and resolution required to satisfy the entire "chain of users," from the atmospheric physicist to the disaster relief coordinator on the ground.