
Valuation of Social Networks: Why Your "Interconnectedness" is the Real Asset
Valuation of online social networks taking into account users’ interconnectedness
The paper proposes an economic valuation model for Online Social Networks (OSN) that explicitly incorporates user interconnectedness as a driver of firm value. It introduces an adapted PageRank-based centrality measure to quantify user integration and demonstrates the model's efficacy through a case study of XING.com, achieving a valuation remarkably close to the actual market capitalization.
TL;DR
How much is a Facebook or LinkedIn user actually worth? This seminal paper argues that standard accounting fails because it views users as isolated nodes. By introducing an Adapted PageRank methodology, the authors prove that a user’s value is exponentially tied to their "interconnectedness." When applied to the European network XING.com, their model predicted a market value within 5% of the actual stock price.
The "Isolation" Problem in Modern Valuation
Traditional business valuation relies on discounted cash flows (DCF) or book values. However, for Online Social Networks (OSNs), the physical assets are negligible. The real value lies in the users.
The authors point out a critical flaw in prior "Customer Equity" models: they treat users like subscribers to a magazine. In a social network, a user who pays nothing but has 1,000 active connections is infinitely more valuable than a paying user with zero contacts. Why? Because the well-connected user creates network effects—they attract new members and make it harder for existing ones to leave (the "lock-in" effect).
Methodology: Mapping Social Capital to Cash Flow
The core of the paper is a mathematical shift from Average Retention to Network-Driven Retention.
1. The Retention Function
The authors propose that a user's retention rate () is a function of their interconnectedness (). They use an arctangent-based formula to model two physical intuitions:
- A.1 (Lock-in): Higher connectivity leads to higher retention.
- A.2 (Diminishing Returns): As you get more connected, the marginal increase in your loyalty starts to level off.
2. Quantifying Interconnectedness (The Adapted PageRank)
To measure , the authors critique standard centrality measures:
- Degree Centrality: Too simple; ignores who your friends know.
- Betweenness/Closeness: Computationally heavy and often misleading for economic value.
Instead, they adapt Google's PageRank. While the original PageRank was designed for directed web links, the authors' version handles the symmetric nature of "friendships."
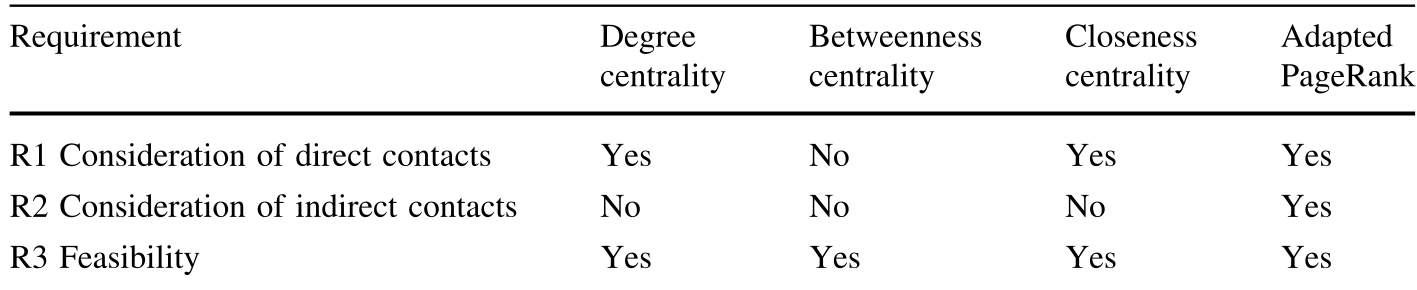
Table: The Adapted PageRank is the only measure meeting all requirements for OSN valuation.
Real-World Case Study: XING.com
The authors put their theory to the test using XING.com during its high-growth phase (2008).
The Setup
- Sample: 1,000 random Premium Members.
- Data: Publicly available annual reports and profile "degree centrality" (the number of direct contacts).
- Variables: Membership fees (€5.95/month), marketing costs, and a discount rate of 11% based on the CAPM model.
The Results
By projecting the growth of users and their connections, the model reached a Customer Equity (CE) of €219.14 million.
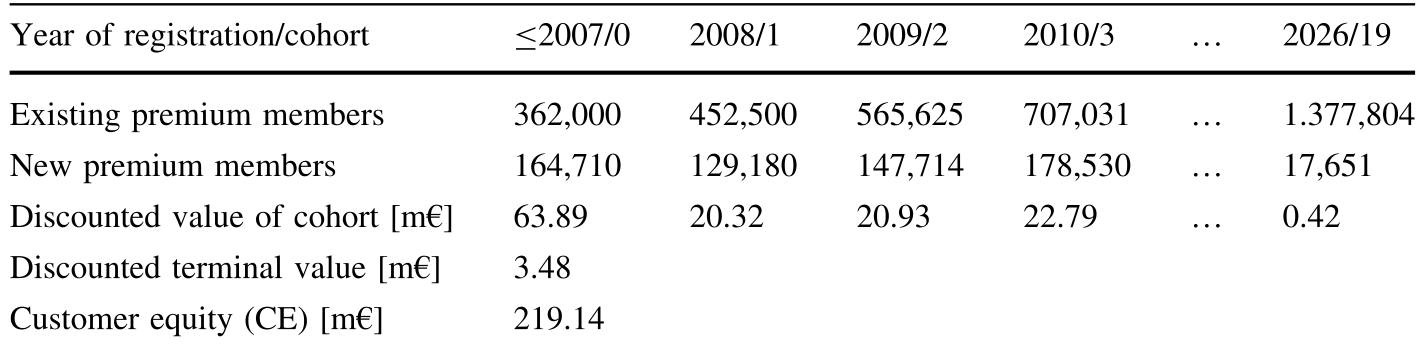
Experimental Result: The discounted cohort values and terminal value for XING.
The market capitalization of XING at the time was €229.89 million. A 4.7% difference is a stunning achievement for a model built primarily on public data.
Deep Insights & Takeaways
- Social Ties as Retention Insurance: The study confirms that every additional contact a user makes acts as a "switching cost." This justifies the high acquisition costs OSNs pay for "influencer" hubs.
- Public Data Power: It proves that external investors can estimate the "true north" of a tech company’s value by sampling the network's topology, even without access to internal databases.
- Limitations: The model assumes that "interconnectedness" remains constant or grows predictably. In reality, "Social Fatigue" or the emergence of a competitor (like the shift from MySpace to Facebook) can collapse these network effects regardless of connectivity.
Conclusion
This paper serves as a bridge between Graph Theory and Financial Accounting. It tells us that in the digital age, a company's balance sheet is not a spreadsheet—it's a graph. If you want to value a platform, stop looking at the revenue per user in isolation and start looking at the strength of the edges between them.