
Zinsight: Deciphering the "Matrix" of Mainframe System Traces
Visual and algorithmic tooling for system trace analysis: a case study
This paper introduces Zinsight, a visual and analytic tool designed to reconstruct and interpret massive system event traces (millions of events/sec) from the IBM zOS environment. By combining human-centric visualization with automated pattern extraction, it enables performance analysts to diagnose complex bottlenecks and system failures in high-parallelism mainframe architectures.
TL;DR
In the high-stakes world of mainframe computing (IBM zOS), a single performance glitch can disrupt global financial services. Zinsight is a sophisticated visual analytics suite that transforms millions of raw, low-level system events into intuitive graphical patterns. By bridging the gap between automated statistics and human intuition, it allows analysts to "see" bottlenecks and logic errors that automated tools often miss.
The Motivation: When Automation Isn't Enough
System administrators face a daunting paradox: modern mainframes generate millions of events per second (interrupts, lock obtains, context switches), but when a system crashes, the logs are often incomplete or "noisy."
Current SOTA (State Of The Art) approaches often rely on machine learning for anomaly detection. However, the authors argue that human-in-the-loop analysis is irreplaceable because:
- False Positives: Automation lacks the business context to determine if a deviation is truly a bug.
- Broken Traces: In unstable systems, the data itself might be mangled, requiring human deductive reasoning to "fill in the blanks."
- Legacy Complexity: Many mainframe environments run highly parallel legacy code where performance issues often stem from subtle timing interactions.
Methodology: The Three Pillars of Zinsight
Zinsight moves beyond simple "Gantt charts" by offering three interconnected views that allow for multi-dimensional drill-downs.
1. Events Flow View (The Temporal Map)
Instead of scrolling through lines of text, events are color-coded by component and mapped logically over time. Analysts can visually detect "phases" or repetitive patterns. Interestingly, the tool uses white markers within event boxes to show where in a specific module the code was executed—a clever way to provide granularity without clutter.
2. Statistics View (The Magnitude Meter)
This view organizes events by frequency and type. The "Elapsed Time" mode is the standout feature here: it renders event bars with variable heights. A sudden "tall" bar (red) in a sea of "short" bars (blue/green) immediately signals a latency outlier.
3. Sequence Context View (The Logic Flow)
Perhaps the most powerful feature, this view allows an analyst to right-click an anomaly and ask "How did we get here?". The tool automatically extracts the execution flow pattern leading to that event, constructing a directed graph of module transitions.
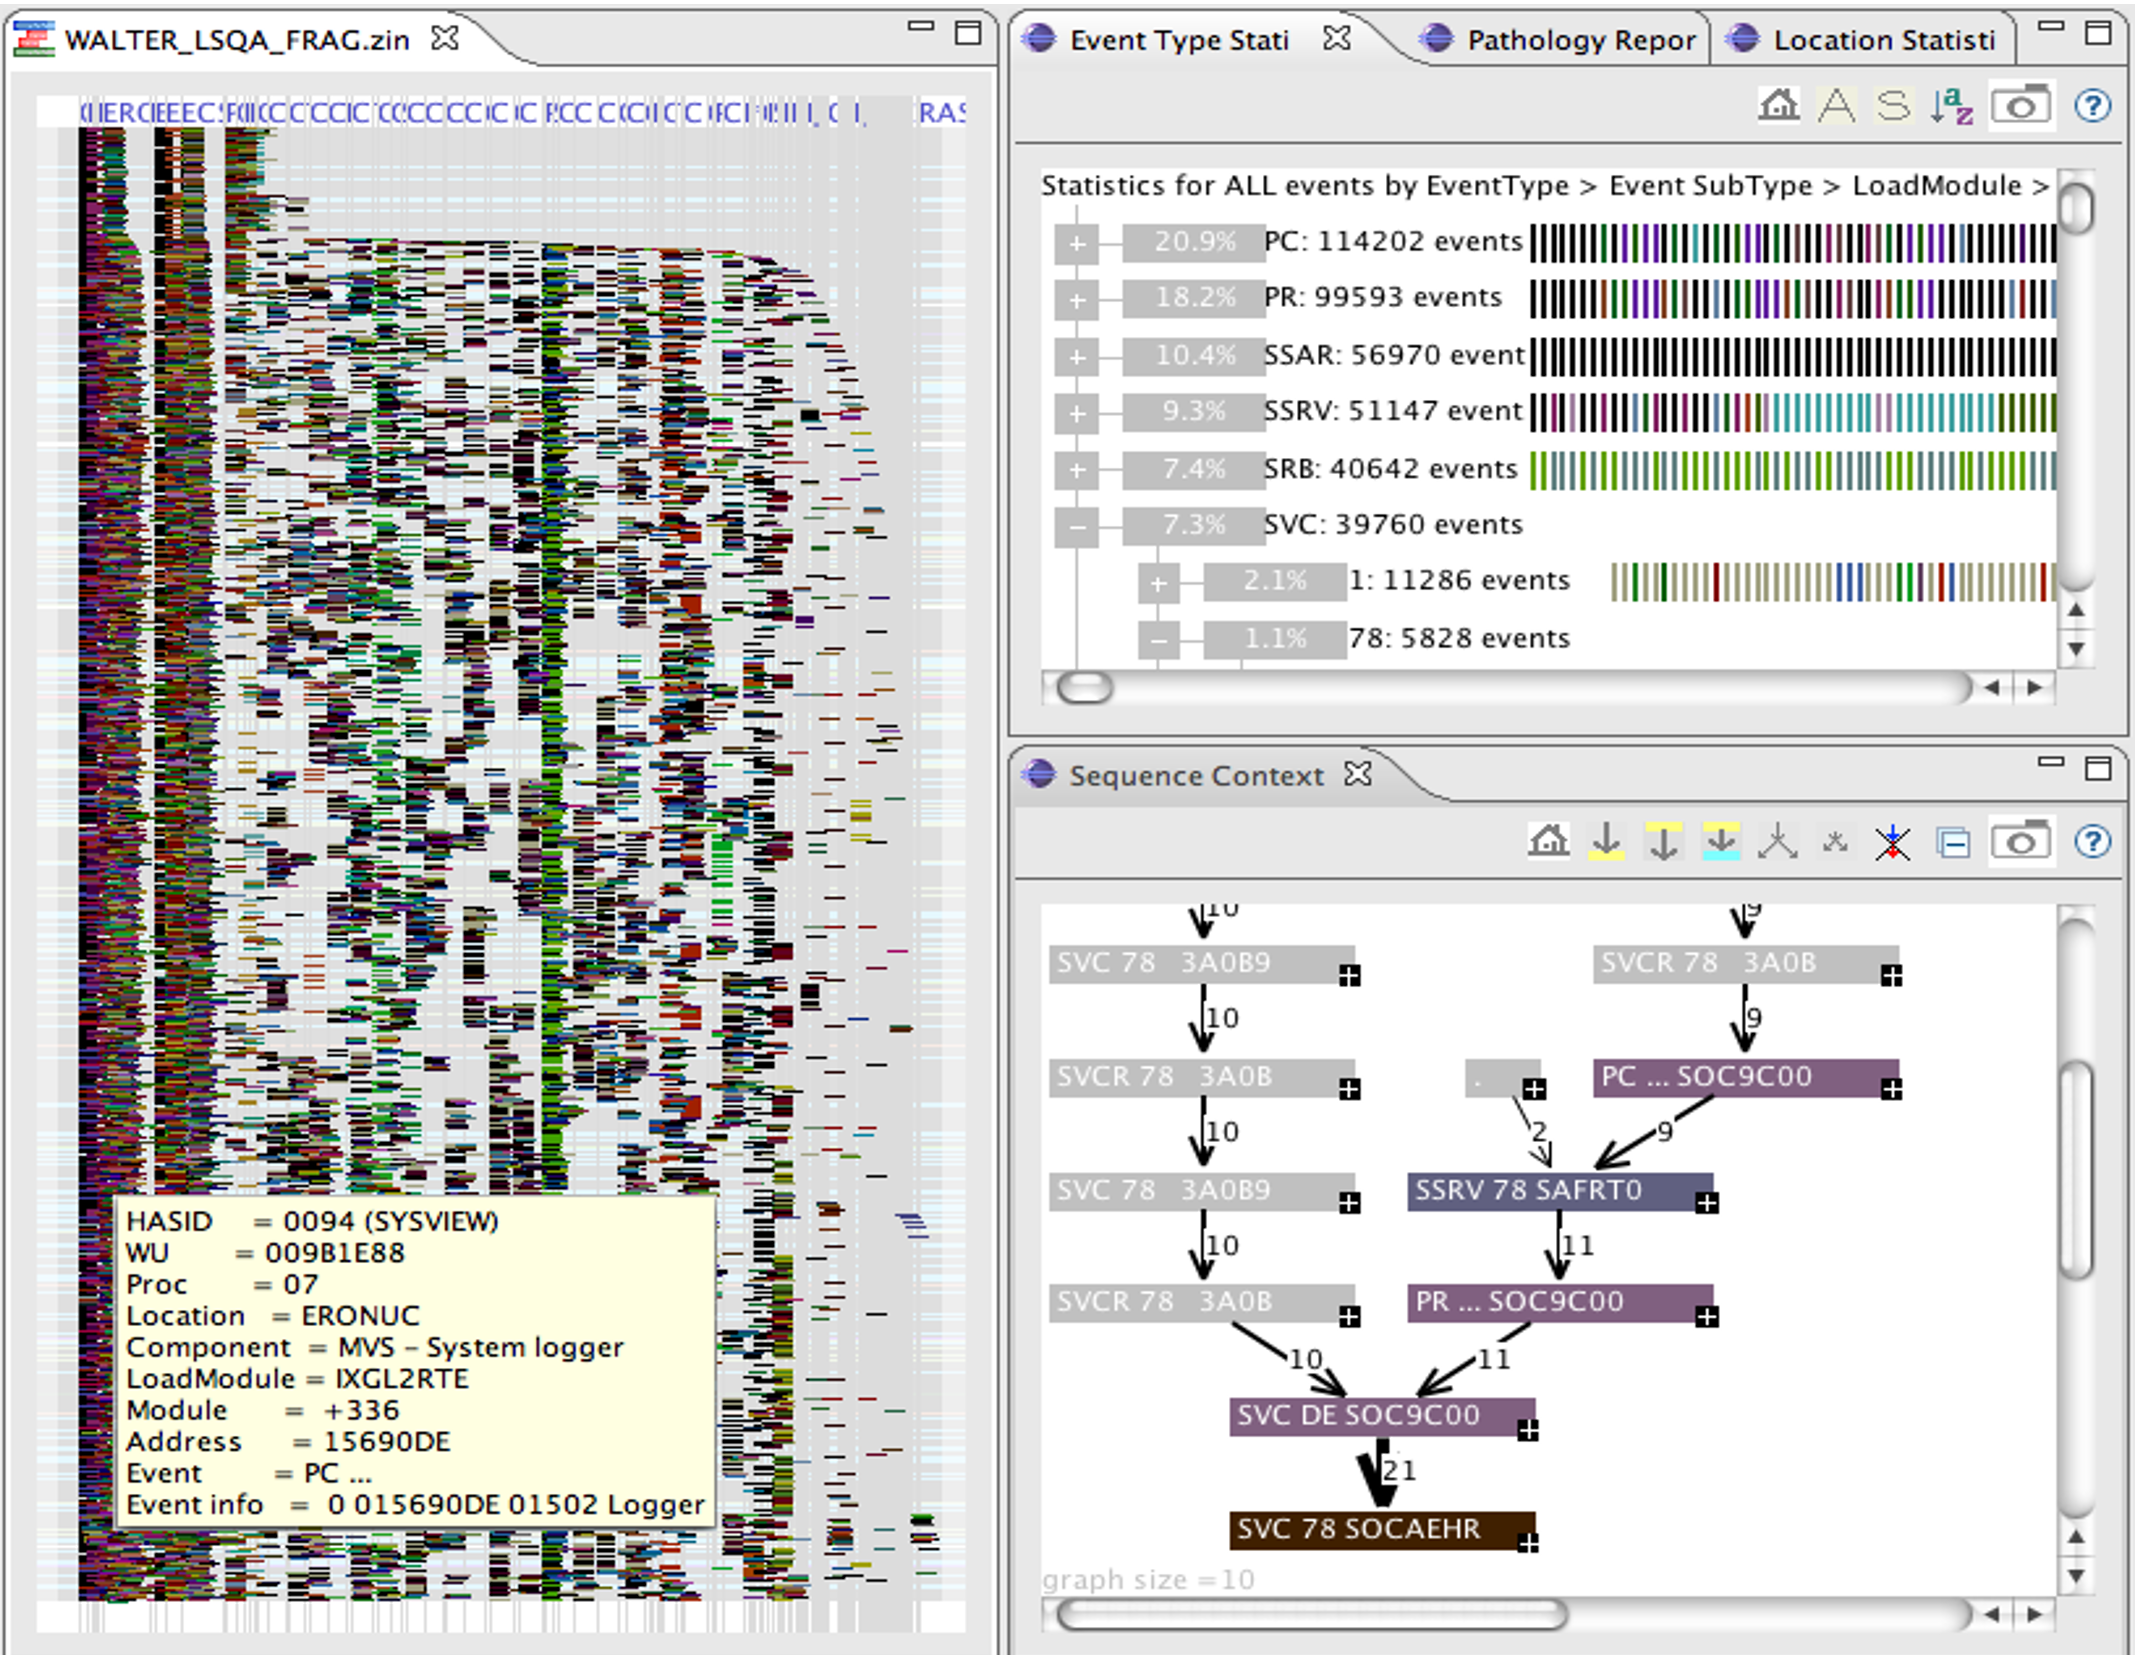 Figure 1: The Zinsight Dashboard showing Events Flow (left), Statistics (top right), and Sequence Context (bottom right).
Real-World Impact: Two Critical Case Studies
Case 1: The Frustrated Memory Queue
A bank upgraded to a new processor but saw a drop in performance. Using the Statistics View, analysts found thousands of SVC 78 (Obtain Memory) events. By switching to "Elapsed Time" mode, they spotted high-latency outliers. The Sequence Context View (Figure 7 in the paper) pinpointed that these requests were coming from security credential flows. It turned out that a common service routine was traversing a fragmented memory queue—a classic legacy code issue exposed by faster hardware.
 Figure 2: The Sequence Context view uncovering the "How did we get here?" path for a memory bottleneck.
Case 2: The "Silent" Hypervisor Latency
Another application couldn't saturate its processors despite heavy load. Analysts used Zinsight to visualize the absence of events. By separating trace views by individual processors, they noticed "blank spaces" on Processor 0. While Processor 1 was struggling with dispatch latency, Processor 0 was idling because a "wake-up signal" was never sent. Automated tools looking for "errors" missed this, as an idle processor isn't an "error"—it's an inefficiency.
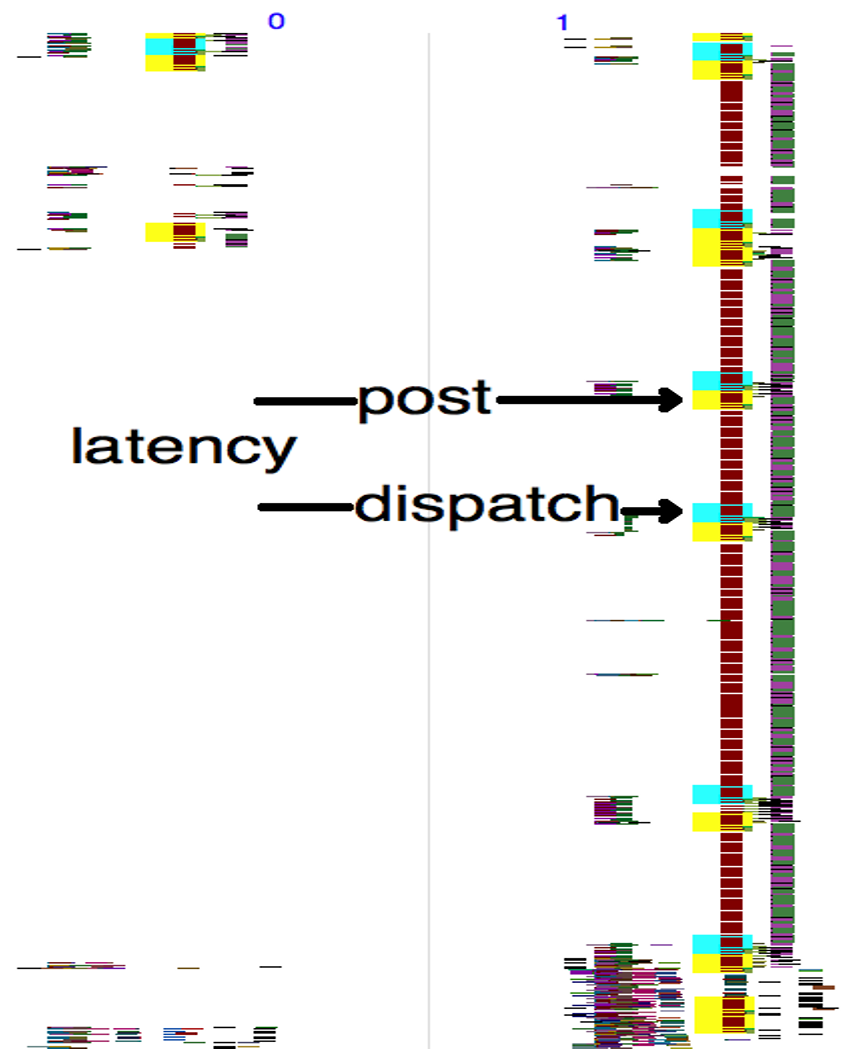 Figure 3: Highlighting how the lack of events (empty space on the left) revealed a hypervisor dispatch bug.
Critical Analysis & Conclusion
Zinsight proves that for complex system debugging, visualization is a form of compression. It allows a human brain to process millions of data points by looking for visual symmetry, interruptions, and outliers.
Strengths:
- Domain Integration: Linking raw hex addresses to actual module names (e.g.,
IGVFLSQA) makes the tool usable for analysts who aren't the original code authors. - Relational Navigation: The ability to jump between statistical frequency and temporal flow maintains context during deep dives.
Limitations:
- The current tool focuses primarily on the OS/Application layer. As the authors note, future work must bridge the gap between hardware millicode, hypervisors, and the application layer to solve cross-stack "silo" problems.
Future Outlook: As we move toward even more distributed systems and microservices, the "Sequence Context" approach will likely become a standard part of cloud-native observability (like OpenTelemetry), where the challenge isn't just if a trace exists, but what pattern it represents globally.