
C-Group: Unveiling the Evolution of Human Connections through Pairwise Dynamic Analysis
Visual analysis of dynamic group membership in temporal social networks
This paper introduces C-Group, a visual analytic tool designed for the pairwise analysis of dynamic group membership in temporal affiliation networks. Unlike traditional ego-centric or global network visualizations, C-Group focuses on the evolving shared and non-shared affiliations of a "focal pair" of actors over time.
TL;DR
C-Group is a specialized visual analytics tool that shifts the focus from "who knows whom" in a total network to "how do these two people interact over time?" By treating a pair of actors as the focal point, it visualizes the birth, growth, and divergence of their shared professional or social groups within temporal affiliation networks.
The "Pairwise" Gap in Social Network Analysis
Most network visualizations suffer from the "hairball" effect—a tangled mess of nodes and edges that represent the whole system. When researchers want to look at a specific relationship, they usually resort to an ego-centric view (centered on one person).
However, many critical questions in social science and professional collaboration are pairwise:
- When did these two researchers start sharing the same student collaborators?
- How did their thematic interests merge after moving to the same university?
- Are they moving together through different industry "groups" or drifting apart?
Prior work lacked the specific UI primitives to answer these questions efficiently. C-Group was built to fill this void by prioritizing the focal pair.
Methodology: Flexible Semantics and Spatial Stability
The core innovation of C-Group lies in its data model and how it maps that model to a screen.
1. The Two-Mode Affiliation Model
The tool operates on a bipartite structure: Actors and Events. Actors (e.g., authors) are linked to Events (e.g., papers). By adding a time attribute to events, C-Group can slice the network into temporal windows.
2. Grouping Semantics
One size does not fit all. C-Group allows users to define groups dynamically:
- Actor-based: Grouping by metadata like institutional affiliation.
- Event-based: Grouping by topics (e.g., "Human-Computer Interaction" vs. "Infovis").
- Participation-based: Grouping by roles (e.g., "Primary Author" vs. "Co-author").
3. Visual Layouts
The tool provides two distinct views to maintain mental map stability during animation:
- Dynamic Group Layout: Groups move between three regions (Actor 1 only, Shared, Actor 2 only). This highlights the "migration" of interests or collaborators.
- Fixed Entity Layout: Keeps specific entities in dedicated lanes, emphasizing which individuals appear and disappear over time within the focal pair's orbit.
 Figure 1: The C-Group interface, featuring the focal pair selector, the group context viewer, and the data detail pane.
Case Study: The Collaborative Marriage
The authors validated C-Group using 22 years of ACM Digital Library data. They focused on Ben Bederson and Allison Druin, two prominent HCIL researchers who are also married.
The visualization revealed a clear narrative:
- Early Career: Disjoint circles; they worked in similar fields (CSCW) but had zero shared collaborators.
- Convergence: Upon joining the University of Maryland (HCIL), their shared region exploded with new topics and shared co-authors.
- Maturity: The "shared" central column became the dominant feature of their professional lives, though individual niche topics still flickered in the side regions.
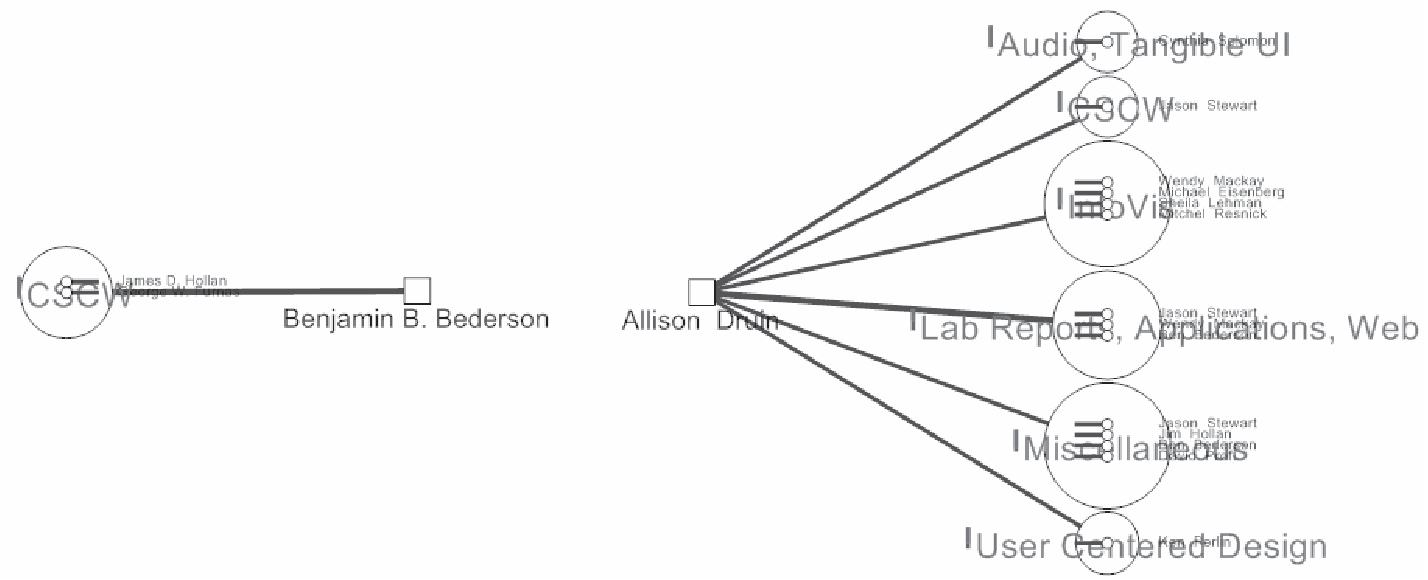 Figure 2: Snapshots of the Bederson-Druin collaboration evolution, showing the migration of topics into the shared central region.
Critical Insight: Why it Works
The brilliance of C-Group is its Inductive Bias toward stability. In dynamic network visualization, the biggest enemy is "cognitive load" caused by nodes flying everywhere. By fixing the focal pair as spatial anchors (two squares on opposite sides), the user has a constant reference point. The movement of groups into the "middle ground" becomes an intuitive proxy for "closeness" and "alignment."
Limitations and Future Outlook
While powerful for pairs, C-Group is naturally limited to small-scale interaction analysis. It cannot easily represent "Group-to-Group" dynamics or very large cohorts. Future iterations could explore higher-order focal sets (e.g., a trio or a small lab) and automated "event detection" to alert users when a focal pair's shared group structure undergoes a significant topological shift.
C-Group represents a move toward Task-Specific Visual Analytics, proving that by narrowing our sight, we can often see much more.